Operation Marble
Due to the large concentration of licensed premises and nightclubs in the centre of Brighton, a high proportion of the Division’s violent crime and serious sexual offences are committed within a relatively small area.
The Division receives a large influx of visitors to the city centre at weekends. Many of these people attend the pubs and nightclubs during nighttime hours, and as a result, an enhanced policing operation (with Directed Patrol Activity (DPA)) is provided, called Operation Marble.
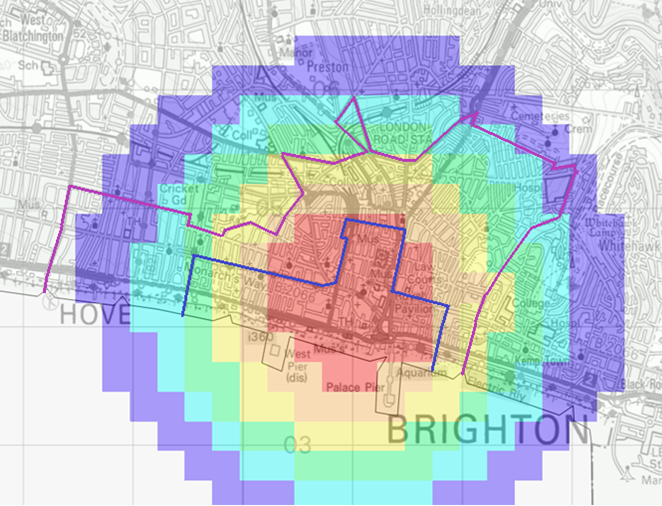
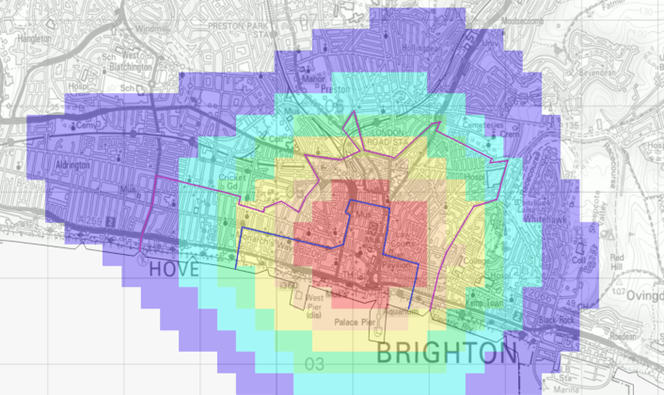
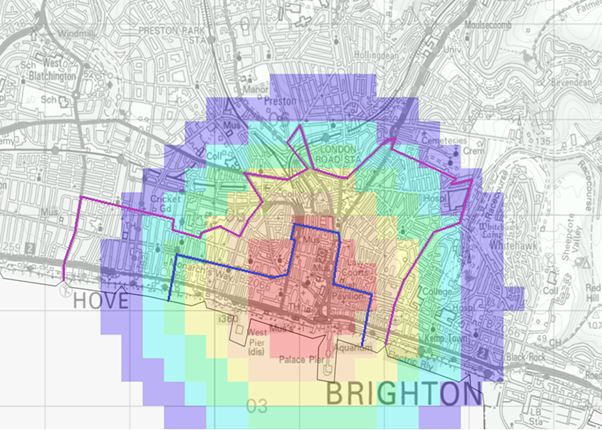
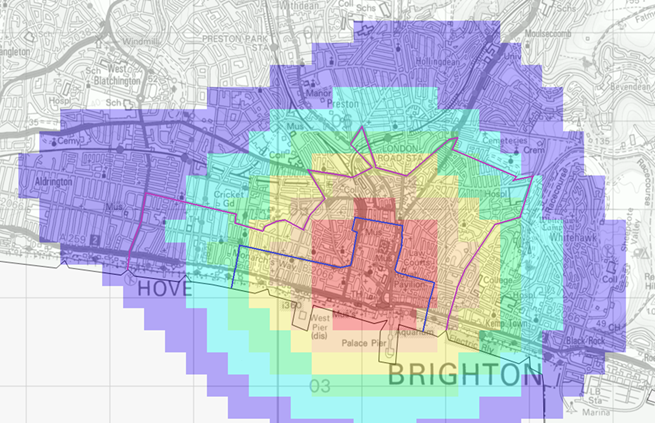
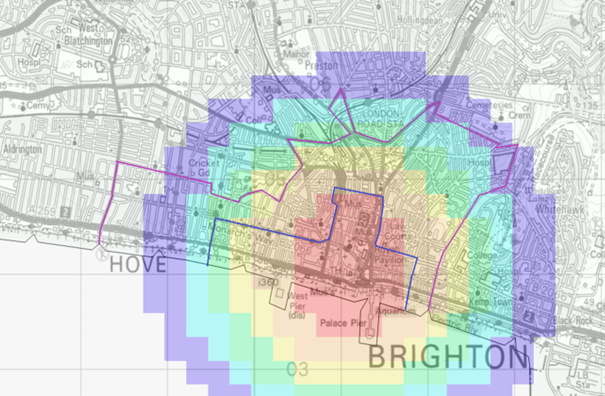
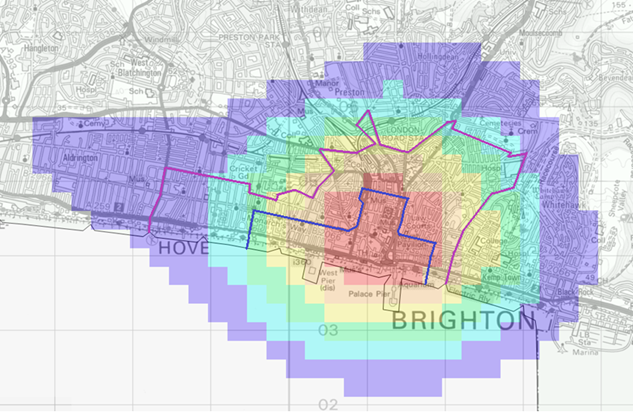
Op Marble covers an area between Preston Street to the West, The Level to the North, Kemptown to the East and the seafront between West Pier and Concorde 2 to the South.
This covers the area previously designated as the Cumulative Impact Zone (now referred to as the City Safety Area) and is regularly under review to ensure that limited police resources are being used to their optimum.
The emphasis of Op Marble is a highly visible presence of officers deployed on foot, as well as a focus on regularly updated hot spots (produced using live crime and incident data) to help reduce the risk of violent crimes.
Op Marble runs on a Friday and Saturday night in response to pressures from the Nighttime Economy, as with later opening pubs, bars, clubs and late-night refreshment premises, an increase in crime (particularly violent crime associated with alcohol) is seen in the earlier hours of the morning.
Several supporting initiatives run alongside the police during the Op Marble time frame, including:
- BCRP NTE briefing (Friday nights)
- Safe Space
- Night Safety Marshalls
- Beach Patrol
- Taxi Marshalls
Standalone operations still exist to cover significant events in the calendar, such as the Halloween weekend, Bank Holidays, Christmas, New Year’s Eve and Pride to reduce risk with an adjusted police presence/response.
Post Covid-19 has seen some shifts in how people go out and enjoy themselves in the Night Time Economy, and the scope of data considered for the police analysis does not cover any periods of lockdown, beginning from 1st January 2022.
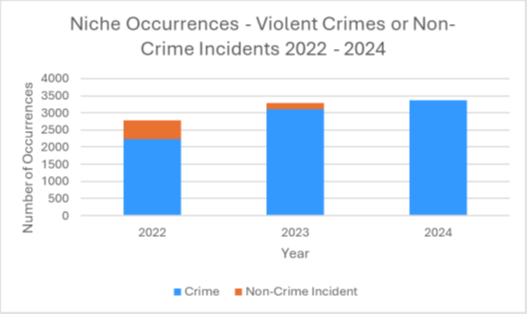
The data analysis (as included below in Graph 1) has shown that between 2022 to 2024, there has been a year-on-year increase in violent occurrences both during the hours covered by Operation Marble and within the non-Marble hours data sets.
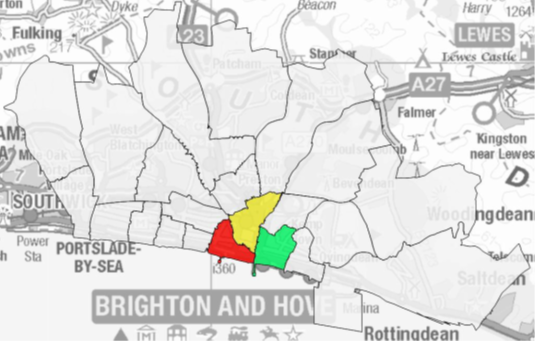
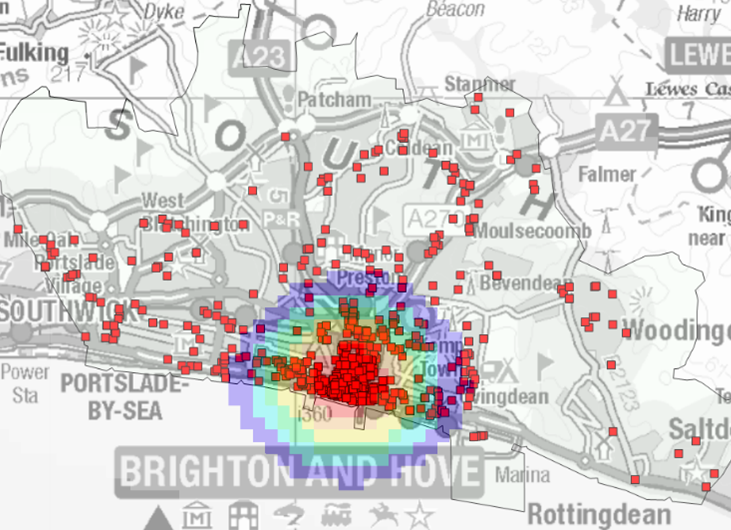
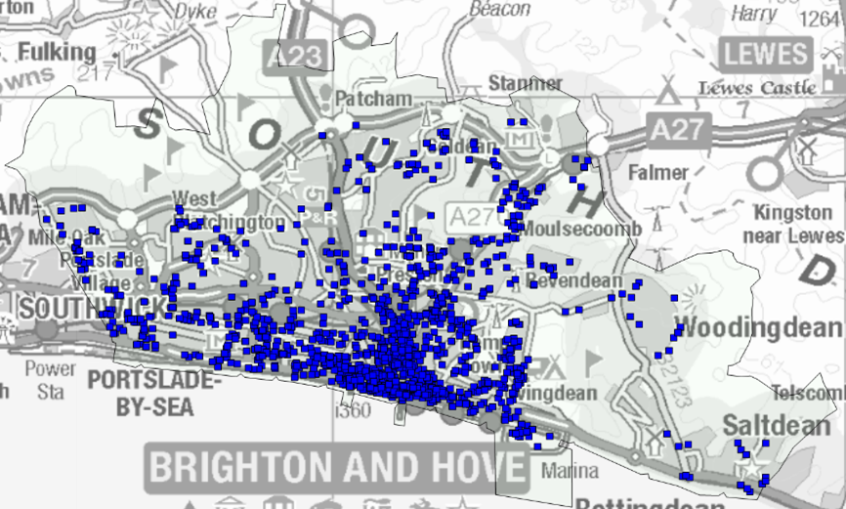
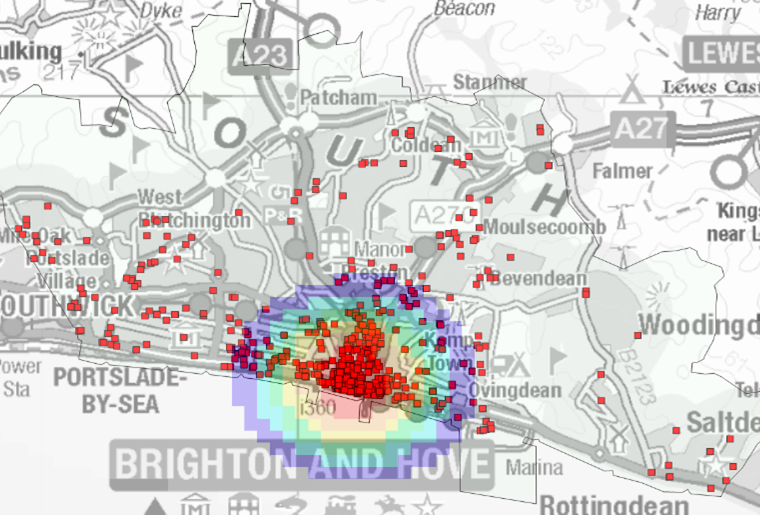
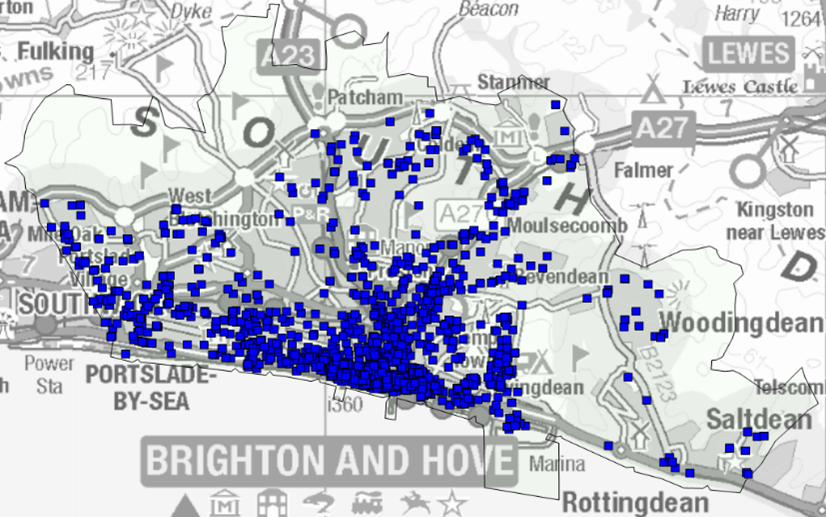
Police data confirms that the hotspot of violent occurrences and intoxication continues to be focused within the city centre, where there are high volumes of licensed premises, hospitality and nighttime economy venues.
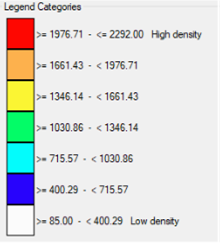
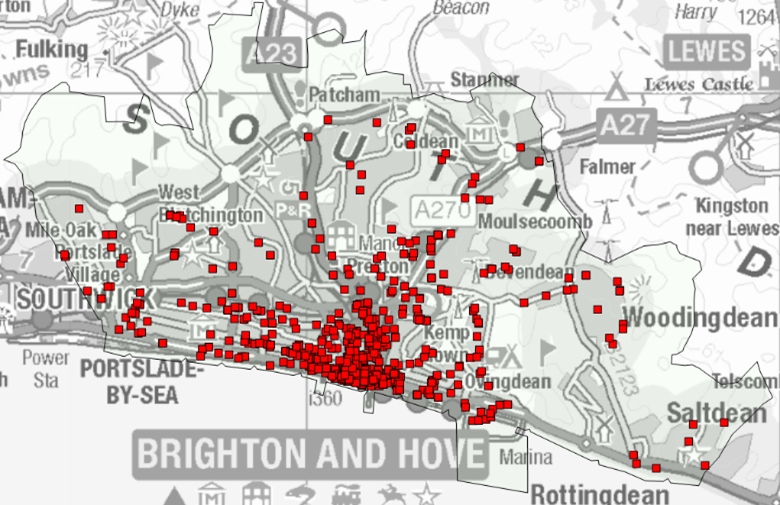
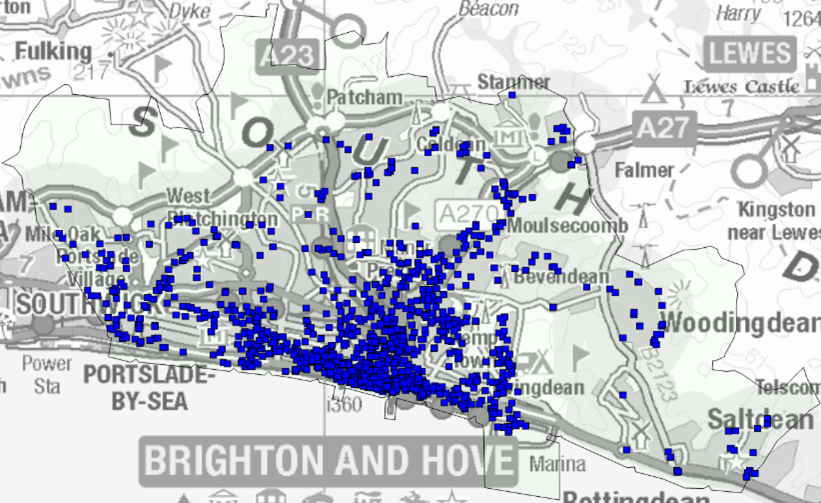
Based on Sussex Police Beat areas, the highest volumes of violent crimes and intoxication between 1 January 2022 and 31 December 2024 are shown in Map 1 below. These were in:
- Regency (CC1003), where there were 2292 violent occurrences involving intoxication
- St Peter's & North Laine (CC1004) with 1609 occurrences
- Queens Park (CC2005) with 1094 occurrences
This map is inclusive of all occurrences within both the Operation Marble DPA timings and the non-Marble days and hours over the 3 years.
Graph 1: Overall Violent Occurrences & Intoxication in Brighton & Hove 2022 to 2024
All occurrences have either ‘ALC’ or ‘DRG’ Class NICL, or the Substance Use field contains:
- ‘affected by alcohol’
- ‘affected by drink and drugs’
- ‘affected by drink or drugs’
- ‘affected by drugs’
Further caveats to the data can be found in Appendix A.
| 2022 | 2023 | 2024 | |
|---|---|---|---|
| Crime | 2229 | 3107 | 3360 |
| Non-Crime Incident | 547 | 182 | 0 |
| Total | 2776 | 3289 | 3360 |
Map 1: Overall Violent Occurrences & Intoxication in Brighton & Hove 2022 to 2024
The map below will only capture occurrences where eastings and northings of an address were completed. Therefore, there will be some occurrences missing from the map.
Further analysis shows that overall, there was an increased risk of violent occurrences and intoxication in the evening hours and the early hours of the morning, both during the Marble DPA timings and outside the Marble DPA hours (as shown in Tables 1a-c and 2a-c).
There is a similarity between increased risk hours and the hotspot location for both the data set timings, evidencing that there is a continual risk of violence and intoxication throughout the week.
The caveats for the data used are provided at the end of this document (Appendix A).
Hotspot maps
Hotspot Maps and Police analysis to support continuation of the current focus and footprint of a Special Policy covering the city centre within the Statement of Licensing Policy
Data was drawn from Police systems to cover 2 distinct time frames:
- Op Marble DPA (Directed Patrol Activity) Data - any violent occurrences based on the search criteria that occurred between Friday 7pm to 7am Saturday, and Saturday 7pm to 7am Sunday.
- Non-Marble Data - any violent crimes based on the search criteria that occurred outside of the Op Marble timings. Crimes where the time frame was over a long period were also included, meaning there is a likely chance that the offence may have occurred during Op Marble times but is not specified, e.g. Thursday 9pm to Monday 8:30am, there is a realistic probability it could have occurred during either Marble or Non-Marble hours.
A search of police crime data recording systems was completed by an analyst searching:
- the date actual from ‘01/01/2022 – 31/12/2024’
- the area division ‘Brighton and Hove’
- the Home Office Crime Group ‘Violent Crime’, the Class NICL (National Incident Category List) ‘ALC’ or ‘DRG’, or the Substance Use field equal to:
- ‘affected by alcohol’
- ‘affected by drink and drugs’
- ‘affected by drink or drugs’
- ‘affected by drugs’
Domestic abuse occurrences were included in both data sets. All caveats for the data and sources can be found in Appendix A at the end of this document.
A number of maps are included below to demonstrate crime hot spots within the city centre and how the current special policy areas, Cumulative Impact Zone (CIZ) and Special Stress Area (SSA), relate to these.
These hotspot maps support the continuation of the current location and boundaries of the Brighton & Hove City Council special policy, as they can be seen to encompass the violent crime hotspots both within the nighttime economy timings (Op Marble) and outside of them, e.g. daytime during the week.
These peaks of risk may be explained in part by student nights as well as social changes, e.g. the increased popularity of going out on a Thursday evening.
Key to maps
The squares represent an individual event of crime during the time period mentioned. Each square = one violent crime.
Red squares indicate crimes during the Op Marble timings, and blue squares indicate crimes outside the Op Marble timings.
The colours overlaid on the maps represent crime number density as follows.
Hotspot maps 2022
2022 City-Wide Crime
Op Marble Timings
Non-Marble Timings
2022 City Centre Crime Hotspot
Op Marble Timings
Non-Marble Timings
Hotspot maps 2023
2023 City-Wide Crime
Op Marble Timings
Non-Marble Timings
2023 City Centre Crime Hotspot
Op Marble Timings
Non-Marble Timings
Hotspot maps 2024
2024 City-Wide Crime
Op Marble Timings
Non-Marble Timings
2024 City Centre Crime Hotspot
Op Marble Timings
Non-Marble Timings
Timings and the matrix approach
Timings and the Matrix Approach
There continues to be an increasing demand for police resources further into the early hours of the morning at the weekends, with the highest risk remaining consistent year on year.
Brighton & Hove is also a university town, and the student population will have an impact on the midweek figures due to student nights and other student-focused events.
Summary of Temporal Analysis
To note: Temporal analysis is calculated based on probability. Police will not always know an exact time a crime occurred, and so when it could have occurred over a few hours, the whole time frame will be used. This results in a decimal result in the data as opposed to a whole number.
The core hours of 10pm on a Friday until 4am on a Saturday and 9pm on a Saturday until 4am on a Sunday show the highest risk across all 3 years’ worth of data, with this extending into moderately high risk until 5am both Saturday and Sunday in 2022, 2023 and 2024.
This consistent demand for policing until the early hours across all 3 years of data provides evidence of the risk for violent crime that is affected by intoxication, particularly in the city centre.
Any extension to licensable hours or additional licensed premises granted without careful consideration is highly likely to add to the existing issues that Brighton & Hove already faces.
The numbers in the tables show the total number of individual incidents of crime during the stated date period.
Operation Marble timings
Table 1a – Op Marble Timings 2022 (01/01/2022 to 31/12/2022)
| Monday | Tuesday | Wednesday | Thursday | Friday | Saturday | Sunday | Total | |
|---|---|---|---|---|---|---|---|---|
| Midnight to 1am | 0.00 | 0.00 | 0.00 | 0.00 | 0.00 | 55.29 | 68.09 | 123.38 |
| 1am to 2am | 0.00 | 0.00 | 0.00 | 0.00 | 0.00 | 52.29 | 70.79 | 123.08 |
| 2am to 3am | 0.00 | 0.00 | 0.00 | 0.00 | 0.00 | 53.96 | 57.54 | 111.49 |
| 3am to 4am | 0.00 | 0.00 | 0.00 | 0.00 | 0.00 | 50.76 | 48.73 | 99.48 |
| 4am to 5am | 0.00 | 0.00 | 0.00 | 0.00 | 0.00 | 31.87 | 24.03 | 55.89 |
| 5am to 6am | 0.00 | 0.00 | 0.00 | 0.00 | 0.00 | 19.20 | 18.95 | 38.15 |
| 6am to 7am | 0.00 | 0.00 | 0.00 | 0.00 | 0.00 | 6.27 | 11.25 | 17.52 |
| 7am to 8am | 0.00 | 0.00 | 0.00 | 0.00 | 0.00 | 0.00 | 0.00 | 0.00 |
| 8am to 9am | 0.00 | 0.00 | 0.00 | 0.00 | 0.00 | 0.00 | 0.00 | 0.00 |
| 9am to 10am | 0.00 | 0.00 | 0.00 | 0.00 | 0.00 | 0.00 | 0.00 | 0.00 |
| 10am to 11am | 0.00 | 0.00 | 0.00 | 0.00 | 0.00 | 0.00 | 0.00 | 0.00 |
| 11am to 12pm | 0.00 | 0.00 | 0.00 | 0.00 | 0.00 | 0.00 | 0.00 | 0.00 |
| 12pm to 1pm | 0.00 | 0.00 | 0.00 | 0.00 | 0.00 | 0.00 | 0.00 | 0.00 |
| 1pm to 2pm | 0.00 | 0.00 | 0.00 | 0.00 | 0.00 | 0.00 | 0.00 | 0.00 |
| 2pm to 3pm | 0.00 | 0.00 | 0.00 | 0.00 | 0.00 | 0.00 | 0.00 | 0.00 |
| 3pm to 4pm | 0.00 | 0.00 | 0.00 | 0.00 | 0.00 | 0.00 | 0.00 | 0.00 |
| 4pm to 5pm | 0.00 | 0.00 | 0.00 | 0.00 | 0.00 | 0.00 | 0.00 | 0.00 |
| 5pm to 6pm | 0.00 | 0.00 | 0.00 | 0.00 | 0.00 | 0.00 | 0.00 | 0.00 |
| 6pm to 7pm | 0.00 | 0.00 | 0.00 | 0.00 | 0.00 | 0.00 | 0.00 | 0.00 |
| 7pm to 8pm | 0.00 | 0.00 | 0.00 | 0.00 | 16.22 | 26.30 | 0.00 | 42.52 |
| 8pm to 9pm | 0.00 | 0.00 | 0.00 | 0.00 | 19.57 | 29.69 | 0.00 | 49.27 |
| 9pm to 10pm | 0.00 | 0.00 | 0.00 | 0.00 | 33.41 | 41.69 | 0.00 | 75.10 |
| 10pm to 11pm | 0.00 | 0.00 | 0.00 | 0.00 | 37.77 | 44.09 | 0.00 | 81.86 |
| 11pm to midnight | 0.00 | 0.00 | 0.00 | 0.00 | 49.40 | 51.87 | 0.00 | 101.27 |
| Total | 0.00 | 0.00 | 0.00 | 0.00 | 156.37 | 463.27 | 299.36 | 919.00 |
Table 1b – Op Marble Timings 2023 (01/01/2023 – 31/12/2023)
| Monday | Tuesday | Wednesday | Thursday | Friday | Saturday | Sunday | Total | |
|---|---|---|---|---|---|---|---|---|
| Midnight to 1am | 0.00 | 0.00 | 0.00 | 0.00 | 0.00 | 63.64 | 70.61 | 134.25 |
| 1am to 2am | 0.00 | 0.00 | 0.00 | 0.00 | 0.00 | 59.14 | 84.44 | 143.58 |
| 2am to 3am | 0.00 | 0.00 | 0.00 | 0.00 | 0.00 | 62.67 | 67.03 | 129.70 |
| 3am to 4am | 0.00 | 0.00 | 0.00 | 0.00 | 0.00 | 39.17 | 45.49 | 84.67 |
| 4am to 5am | 0.00 | 0.00 | 0.00 | 0.00 | 0.00 | 26.81 | 36.48 | 63.29 |
| 5am to 6am | 0.00 | 0.00 | 0.00 | 0.00 | 0.00 | 15.04 | 15.34 | 30.38 |
| 6am to 7am | 0.00 | 0.00 | 0.00 | 0.00 | 0.00 | 15.54 | 9.33 | 24.87 |
| 7am to 8am | 0.00 | 0.00 | 0.00 | 0.00 | 0.00 | 0.00 | 0.00 | 0.00 |
| 8am to 9am | 0.00 | 0.00 | 0.00 | 0.00 | 0.00 | 0.00 | 0.00 | 0.00 |
| 9am to 10am | 0.00 | 0.00 | 0.00 | 0.00 | 0.00 | 0.00 | 0.00 | 0.00 |
| 10am to 11am | 0.00 | 0.00 | 0.00 | 0.00 | 0.00 | 0.00 | 0.00 | 0.00 |
| 11am to 12pm | 0.00 | 0.00 | 0.00 | 0.00 | 0.00 | 0.00 | 0.00 | 0.00 |
| 12pm to 1pm | 0.00 | 0.00 | 0.00 | 0.00 | 0.00 | 0.00 | 0.00 | 0.00 |
| 1pm to 2pm | 0.00 | 0.00 | 0.00 | 0.00 | 0.00 | 0.00 | 0.00 | 0.00 |
| 2pm to 3pm | 0.00 | 0.00 | 0.00 | 0.00 | 0.00 | 0.00 | 0.00 | 0.00 |
| 3pm to 4pm | 0.00 | 0.00 | 0.00 | 0.00 | 0.00 | 0.00 | 0.00 | 0.00 |
| 4pm to 5pm | 0.00 | 0.00 | 0.00 | 0.00 | 0.00 | 0.00 | 0.00 | 0.00 |
| 5pm to 6pm | 0.00 | 0.00 | 0.00 | 0.00 | 0.00 | 0.00 | 0.00 | 0.00 |
| 6pm to 7pm | 0.00 | 0.00 | 0.00 | 0.00 | 0.00 | 0.00 | 0.00 | 0.00 |
| 7pm to 8pm | 0.00 | 0.00 | 0.00 | 0.00 | 33.10 | 22.09 | 0.00 | 55.19 |
| 8pm to 9pm | 0.00 | 0.00 | 0.00 | 0.00 | 29.86 | 26.76 | 0.00 | 56.62 |
| 9pm to 10pm | 0.00 | 0.00 | 0.00 | 0.00 | 35.02 | 50.40 | 0.00 | 85.42 |
| 10pm to 11pm | 0.00 | 0.00 | 0.00 | 0.00 | 42.19 | 30.91 | 0.00 | 73.10 |
| 11pm to midnight | 0.00 | 0.00 | 0.00 | 0.00 | 56.81 | 69.11 | 0.00 | 125.92 |
| Total | 0.00 | 0.00 | 0.00 | 0.00 | 196.98 | 481.29 | 328.73 | 1007.00 |
Table 1c – Op Marble Timings 2024 (01/01/2024 – 31/12/2024)
| Monday | Tuesday | Wednesday | Thursday | Friday | Saturday | Sunday | Total | |
|---|---|---|---|---|---|---|---|---|
| Midnight to 1am | 0.00 | 0.00 | 0.00 | 0.00 | 0.00 | 50.12 | 46.04 | 96.16 |
| 1am to 2am | 0.00 | 0.00 | 0.00 | 0.00 | 0.00 | 50.62 | 66.54 | 117.16 |
| 2am to 3am | 0.00 | 0.00 | 0.00 | 0.00 | 0.00 | 59.70 | 65.54 | 125.24 |
| 3am to 4am | 0.00 | 0.00 | 0.00 | 0.00 | 0.00 | 47.53 | 65.63 | 113.16 |
| 4am to 5am | 0.00 | 0.00 | 0.00 | 0.00 | 0.00 | 23.00 | 30.21 | 53.21 |
| 5am to 6am | 0.00 | 0.00 | 0.00 | 0.00 | 0.00 | 20.00 | 13.71 | 33.71 |
| 6am to 7am | 0.00 | 0.00 | 0.00 | 0.00 | 0.00 | 10.00 | 12.38 | 22.38 |
| 7am to 8am | 0.00 | 0.00 | 0.00 | 0.00 | 0.00 | 0.00 | 0.00 | 0.00 |
| 8am to 9am | 0.00 | 0.00 | 0.00 | 0.00 | 0.00 | 0.00 | 0.00 | 0.00 |
| 9am to 10am | 0.00 | 0.00 | 0.00 | 0.00 | 0.00 | 0.00 | 0.00 | 0.00 |
| 10am to 11am | 0.00 | 0.00 | 0.00 | 0.00 | 0.00 | 0.00 | 0.00 | 0.00 |
| 11am to 12pm | 0.00 | 0.00 | 0.00 | 0.00 | 0.00 | 0.00 | 0.00 | 0.00 |
| 12pm to 1pm | 0.00 | 0.00 | 0.00 | 0.00 | 0.00 | 0.00 | 0.00 | 0.00 |
| 1pm to 2pm | 0.00 | 0.00 | 0.00 | 0.00 | 0.00 | 0.00 | 0.00 | 0.00 |
| 2pm to 3pm | 0.00 | 0.00 | 0.00 | 0.00 | 0.00 | 0.00 | 0.00 | 0.00 |
| 3pm to 4pm | 0.00 | 0.00 | 0.00 | 0.00 | 0.00 | 0.00 | 0.00 | 0.00 |
| 4pm to 5pm | 0.00 | 0.00 | 0.00 | 0.00 | 0.00 | 0.00 | 0.00 | 0.00 |
| 5pm to 6pm | 0.00 | 0.00 | 0.00 | 0.00 | 0.00 | 0.00 | 0.00 | 0.00 |
| 6pm to 7pm | 0.00 | 0.00 | 0.00 | 0.00 | 0.00 | 0.00 | 0.00 | 0.00 |
| 7pm to 8pm | 0.00 | 0.00 | 0.00 | 0.00 | 23.25 | 37.00 | 0.00 | 60.25 |
| 8pm to 9pm | 0.00 | 0.00 | 0.00 | 0.00 | 23.42 | 43.00 | 0.00 | 66.42 |
| 9pm to 10pm | 0.00 | 0.00 | 0.00 | 0.00 | 27.92 | 30.33 | 0.00 | 58.25 |
| 10pm to 11pm | 0.00 | 0.00 | 0.00 | 0.00 | 32.50 | 56.50 | 0.00 | 89.00 |
| 11pm to midnight | 0.00 | 0.00 | 0.00 | 0.00 | 44.95 | 49.13 | 0.00 | 94.08 |
| Total | 0.00 | 0.00 | 0.00 | 0.00 | 152.03 | 476.93 | 300.04 | 929.00 |
Non-Operation Marble timings
Non-Marble Timings
Table 2a – Non-Marble Timings 2022 (01/01/2022 – 31/12/2022)
| Monday | Tuesday | Wednesday | Thursday | Friday | Saturday | Sunday | Total | |
|---|---|---|---|---|---|---|---|---|
| Midnight to 1am | 20.02 | 22.76 | 18.23 | 30.79 | 18.10 | 0.68 | 0.73 | 111.32 |
| 1am to 2am | 20.16 | 9.95 | 18.03 | 13.79 | 21.77 | 0.68 | 0.80 | 85.18 |
| 2am to 3am | 16.16 | 17.31 | 9.02 | 19.79 | 26.27 | 0.68 | 1.08 | 90.31 |
| 3am to 4am | 11.83 | 8.81 | 9.63 | 16.21 | 20.77 | 0.68 | 1.08 | 69.00 |
| 4am to 5am | 0.83 | 9.06 | 13.63 | 7.19 | 6.78 | 0.68 | 1.08 | 39.25 |
| 5am to 6am | 3.63 | 5.56 | 6.55 | 3.85 | 3.65 | 0.68 | 1.25 | 25.16 |
| 6am to 7am | 3.63 | 6.56 | 0.55 | 2.85 | 2.65 | 1.18 | 1.25 | 18.66 |
| 7am to 8am | 2.63 | 3.56 | 4.55 | 3.69 | 2.65 | 6.19 | 8.22 | 31.49 |
| 8am to 9am | 7.15 | 7.39 | 5.55 | 3.69 | 8.65 | 3.57 | 6.06 | 42.05 |
| 9am to 10am | 7.11 | 9.39 | 10.50 | 3.69 | 6.65 | 11.57 | 5.29 | 54.21 |
| 10am to 11am | 5.11 | 5.39 | 12.99 | 3.54 | 6.55 | 7.57 | 4.26 | 45.41 |
| 11am to 12pm | 6.78 | 5.81 | 10.74 | 13.52 | 7.55 | 8.48 | 10.24 | 63.11 |
| 12pm to 1pm | 8.94 | 7.33 | 9.19 | 5.52 | 8.55 | 9.46 | 9.12 | 58.11 |
| 1pm to 2pm | 3.94 | 16.83 | 11.32 | 9.52 | 12.44 | 11.46 | 6.16 | 71.67 |
| 2pm to 3pm | 5.10 | 8.80 | 10.32 | 12.16 | 13.44 | 11.96 | 15.15 | 76.93 |
| 3pm to 4pm | 10.07 | 8.45 | 11.17 | 10.80 | 17.47 | 13.25 | 9.80 | 81.02 |
| 4pm to 5pm | 11.94 | 13.95 | 9.28 | 10.30 | 15.95 | 14.25 | 14.39 | 90.05 |
| 5pm to 6pm | 6.94 | 17.03 | 13.74 | 6.88 | 21.14 | 11.75 | 20.84 | 98.31 |
| 6pm to 7pm | 12.77 | 14.59 | 15.78 | 9.87 | 16.68 | 27.55 | 14.70 | 111.94 |
| 7pm to 8pm | 25.19 | 20.95 | 13.78 | 31.01 | 1.68 | 1.46 | 19.85 | 113.93 |
| 8pm to 9pm | 10.69 | 15.19 | 14.03 | 20.06 | 1.10 | 1.00 | 18.85 | 80.93 |
| 9pm to 10pm | 10.09 | 19.19 | 17.96 | 9.06 | 1.10 | 0.76 | 20.81 | 78.98 |
| 10pm to 11pm | 23.92 | 18.02 | 27.99 | 22.27 | 0.85 | 0.83 | 27.77 | 121.65 |
| 11pm to midnight | 14.48 | 31.03 | 17.67 | 23.97 | 0.91 | 0.70 | 23.57 | 112.35 |
| Total | 249.11 | 302.88 | 292.17 | 294.04 | 243.33 | 147.08 | 242.38 | 1771.00 |
Table 2b – Non-Marble Timings 2023 (01/01/2023 – 31/12/2023)
| Monday | Tuesday | Wednesday | Thursday | Friday | Saturday | Sunday | Total | |
|---|---|---|---|---|---|---|---|---|
| Midnight to 1am | 34.63 | 25.78 | 23.77 | 19.45 | 25.55 | 0.64 | 1.09 | 130.91 |
| 1am to 2am | 15.88 | 16.51 | 13.60 | 22.29 | 26.80 | 0.64 | 1.10 | 96.83 |
| 2am to 3am | 19.46 | 15.18 | 10.77 | 15.62 | 24.96 | 0.54 | 0.98 | 87.51 |
| 3am to 4am | 20.46 | 3.85 | 12.27 | 20.54 | 17.38 | 0.68 | 0.87 | 76.04 |
| 4am to 5am | 7.42 | 9.65 | 4.90 | 11.70 | 19.38 | 0.67 | 0.83 | 54.55 |
| 5am to 6am | 3.67 | 3.40 | 4.40 | 5.17 | 6.88 | 0.71 | 1.16 | 25.39 |
| 6am to 7am | 10.42 | 4.40 | 3.40 | 3.47 | 3.55 | 0.71 | 1.08 | 27.02 |
| 7am to 8am | 5.55 | 3.30 | 6.57 | 8.47 | 9.50 | 8.75 | 7.08 | 49.21 |
| 8am to 9am | 9.55 | 2.30 | 12.57 | 11.39 | 6.50 | 7.09 | 13.70 | 63.09 |
| 9am to 10am | 7.47 | 5.30 | 16.83 | 3.43 | 5.50 | 9.95 | 17.20 | 65.69 |
| 10am to 11am | 7.47 | 10.21 | 10.78 | 5.94 | 4.51 | 12.89 | 9.13 | 60.93 |
| 11am to 12pm | 10.46 | 10.21 | 17.41 | 12.95 | 6.85 | 13.50 | 4.63 | 75.99 |
| 12pm to 1pm | 11.40 | 8.32 | 8.55 | 7.36 | 19.85 | 13.29 | 9.13 | 77.90 |
| 1pm to 2pm | 9.40 | 10.32 | 5.63 | 13.28 | 13.35 | 15.79 | 18.63 | 86.40 |
| 2pm to 3pm | 13.90 | 6.25 | 18.63 | 9.42 | 13.88 | 12.24 | 8.63 | 82.97 |
| 3pm to 4pm | 11.78 | 9.81 | 16.63 | 17.03 | 15.38 | 18.62 | 21.26 | 110.52 |
| 4pm to 5pm | 18.72 | 20.31 | 19.13 | 16.66 | 15.88 | 19.16 | 16.76 | 126.62 |
| 5pm to 6pm | 18.47 | 21.79 | 23.13 | 13.66 | 26.71 | 22.65 | 18.81 | 145.23 |
| 6pm to 7pm | 12.97 | 10.29 | 18.52 | 17.49 | 18.14 | 25.97 | 17.43 | 120.81 |
| 7pm to 8pm | 16.72 | 17.79 | 23.76 | 19.66 | 1.14 | 0.97 | 31.39 | 111.43 |
| 8pm to 9pm | 16.72 | 23.83 | 24.04 | 23.20 | 1.15 | 1.01 | 24.17 | 114.12 |
| 9pm to 10pm | 23.57 | 23.71 | 28.67 | 29.05 | 0.82 | 1.17 | 31.17 | 138.15 |
| 10pm to 11pm | 23.71 | 36.21 | 28.67 | 28.22 | 0.76 | 1.17 | 30.59 | 149.33 |
| 11pm to midnight | 19.53 | 28.57 | 24.84 | 13.66 | 0.76 | 1.00 | 28.00 | 116.35 |
| Total | 349.32 | 327.26 | 377.48 | 349.12 | 285.18 | 189.82 | 314.81 | 2193.00 |
Table 2c – Non-Marble Timings 2024 (01/01/2024 – 31/12/2024)
| Monday | Tuesday | Wednesday | Thursday | Friday | Saturday | Sunday | Total | |
|---|---|---|---|---|---|---|---|---|
| Midnight to 1am | 27.60 | 35.83 | 20.10 | 20.74 | 29.13 | 0.64 | 0.57 | 134.62 |
| 1am to 2am | 20.10 | 11.67 | 24.46 | 23.24 | 27.68 | 0.57 | 0.57 | 108.29 |
| 2am to 3am | 18.23 | 16.67 | 13.46 | 29.59 | 11.22 | 0.57 | 0.58 | 90.31 |
| 3am to 4am | 12.73 | 17.01 | 15.96 | 12.96 | 22.72 | 0.57 | 0.58 | 82.53 |
| 4am to 5am | 12.48 | 8.51 | 7.76 | 14.96 | 14.22 | 0.48 | 0.54 | 58.97 |
| 5am to 6am | 7.38 | 9.51 | 5.76 | 8.83 | 5.47 | 0.78 | 0.54 | 38.28 |
| 6am to 7am | 14.80 | 3.68 | 12.26 | 10.70 | 5.47 | 0.78 | 0.54 | 48.24 |
| 7am to 8am | 9.80 | 5.68 | 6.20 | 4.70 | 2.97 | 11.78 | 11.91 | 53.05 |
| 8am to 9am | 2.69 | 10.72 | 8.21 | 15.62 | 2.97 | 8.45 | 6.91 | 55.57 |
| 9am to 10am | 8.71 | 3.81 | 11.51 | 7.62 | 11.45 | 4.62 | 13.91 | 61.63 |
| 10am to 11am | 4.71 | 10.81 | 12.98 | 13.92 | 14.45 | 6.23 | 11.58 | 74.68 |
| 11am to 12pm | 8.32 | 9.15 | 5.77 | 13.42 | 11.52 | 15.23 | 9.58 | 72.98 |
| 12pm to 1pm | 15.34 | 16.43 | 16.35 | 14.42 | 17.46 | 16.73 | 7.53 | 104.25 |
| 1pm to 2pm | 8.38 | 10.84 | 13.84 | 7.92 | 8.47 | 13.73 | 5.94 | 69.11 |
| 2pm to 3pm | 11.37 | 21.51 | 9.34 | 16.42 | 23.41 | 18.81 | 15.94 | 116.79 |
| 3pm to 4pm | 24.24 | 20.17 | 8.34 | 24.42 | 17.40 | 19.64 | 13.94 | 128.14 |
| 4pm to 5pm | 17.37 | 15.46 | 10.30 | 17.75 | 30.48 | 18.60 | 20.94 | 130.89 |
| 5pm to 6pm | 13.88 | 15.46 | 10.30 | 12.75 | 10.81 | 21.32 | 24.88 | 109.40 |
| 6pm to 7pm | 20.88 | 30.40 | 17.30 | 17.42 | 21.60 | 30.32 | 21.46 | 159.38 |
| 7pm to 8pm | 17.13 | 27.09 | 26.62 | 21.09 | 1.59 | 1.17 | 24.06 | 118.75 |
| 8pm to 9pm | 24.83 | 19.84 | 20.73 | 19.89 | 1.11 | 0.50 | 23.30 | 110.19 |
| 9pm to 10pm | 22.24 | 26.76 | 24.56 | 33.89 | 1.11 | 0.54 | 27.75 | 136.85 |
| 10pm to 11pm | 19.91 | 29.80 | 16.19 | 32.89 | 0.62 | 0.54 | 42.79 | 142.74 |
| 11pm to midnight | 19.70 | 23.83 | 41.65 | 24.32 | 0.62 | 0.59 | 28.63 | 139.34 |
| Total | 362.82 | 400.65 | 359.92 | 419.49 | 293.96 | 193.18 | 314.99 | 2345.00 |
Appendix A
Appendix A - Caveats and explanations on the data provided and used
An i-base search of Niche (Police Recording System) Crime Data was completed, searching:
- the date actual from ‘01/01/2022 – 31/12/2024’
- the area division ‘Brighton and Hove’
- the Home Office Crime Group ‘Violent Crime’, the Class NICL (National Incident Category List) ‘ALC’ or ‘DRG’, or the Substance Use field equal to:
- ‘affected by alcohol’
- ‘affected by drink and drugs’
- ‘affected by drink or drugs’
- ‘affected by drugs’
Domestic abuse occurrences were included in both the Op Marble and Non-Marble data sets. Reference made to domestic abuse occurrences is based on the completion of the ‘Hate Crime’ field, which contains ‘DOM’; however, it is reliant on the completion of this field.
Based on the ‘Stats Status Type’ field, any ‘not grouped’ or ‘no crimes’ were removed from the data.
It was requested that the data be inclusive of occurrences with the stats status type as ‘crime’ or ‘non-crime incident’, as whilst crimes are the main focus of the report, non-crime incidents also capture incidents that police have attended or spent time dealing with. This therefore shows the demand during Op Marble and Non-Marble times.
There are some occurrences within the overall data set which have a ‘date actual from’ in either 2022, 2023, or 2024, but the date actual to may end the following year. These incidents have been kept in the data to reflect the search criteria of date actual from.
A caveat to be mentioned - the Class NICL and Substance Use field are reliant on the accuracy of this information being recorded accurately, if at all. Where this field is incomplete, the occurrence would not feature within the data set. Therefore, it is almost certain that there will be a large number of occurrences that will not be included within the data set based on the reliance on the Class NICL and Substance Use field, but those involved were intoxicated.
Numerical data sitting behind Graph 1
| 2022 | 2023 | 2024 | |
|---|---|---|---|
| Crime | 2229 | 3107 | 3360 |
| Non-Crime Incident | 547 | 182 | 0 |
| Total | 2776 | 3289 | 3360 |
The data shows that the overall number of occurrences of violence and intoxication increased year on year. Whilst the number of non-crime incidents has decreased from 2022 to 2024, the number of crimes has increased.
To note, there was a high proportion of non-crime incidents with the HO Return Code Description ‘assault with injury’ in 2022; however, this decreased in 2023, and there were none in 2024.
If the approach to such occurrences has changed, viewing these occurrences as crimes, not non-crime incidents, where there were fewer occurrences in 2023 and none in 2024, then this is likely to have impacted the overall increase in crime data.
The chart shows that over the last 3 years, fewer than a quarter of occurrences during the Op Marble DPA were domestic-related. The year with the highest number of domestic occurrences was 2023, which accounted for 23.5% of all occurrences during the DPA (240 actual).
Domestic Abuse occurrences were any occurrences which contained ‘DOM’ in the Hate Crime field. Also, all occurrences have either ‘ALC’ or ‘DRG’ Class NICL, or the Substance Use field contains: ‘affected by alcohol’, ‘affected by drink and drugs’, ‘affected by drink or drugs’, or ‘affected by drugs’.