1. Introduction
1.1
Brighton & Hove City Council is publishing the workforce ethnicity pay gap voluntarily.
The report follows the government’s ethnicity pay reporting guidance for employers (Appendix A) and the Office for National Statistics (ONS) guidelines for ethnic origin groupings.
The government guidance does not recommend looking at the top 2 measures in isolation, and as such, the wider Ethnic group reporting measures are also reported.
Therefore, this report includes:
- the mean (average) and median ethnicity pay gaps for White, Black and Minority Ethnic (BME) employees*
- the proportions of BME and White employees* in each pay quartile
- the mean (average) and median ethnicity pay gap using hourly pay for Ethnic Groups
- the percentage of each Ethnic group in each hourly pay quartile
- the percentages of employees in different ethnic groups
- the percentage of employees who did not disclose their ethnicity – they either answered ‘prefer not to say’ or did not answer when you attempted to collect their ethnicity.
- the percentage of each ethnic group receiving bonus pay
- the mean (average) pay gap for bonus pay
- median ethnicity pay gap for bonus pay
- the proportions of Black and Minority Ethnic (BME) and White employees who received a bonus
*See Appendix B for ethnic origin groupings.
In line with the ONS ethnicity pay gap reporting, the White binary category includes White British/English/Welsh/Scottish/Northern Irish/White Irish/White-Gypsy/Irish Traveller and Any Other White background groups.
1.2
The reporting data includes council employees who have provided their equalities data and were employed on 31 March 2025.
Apprentices, seasonal, temporary or casual employees are included if they fall within the reference period created by the snapshot date.
Mirroring the gender pay reporting regulations, the data excludes school-based staff.
1.3
Brighton & Hove City Council’s workforce equalities data is provided confidentially and voluntarily by individuals working for the council.
We encourage our workforce to share their equalities data to understand the workforce profile and plan actions to address inequalities. Not all employees choose to share their details.
This report is based on 86.3% of the workforce on the snapshot date who have disclosed their ethnicity data, unless detailed otherwise.
The remaining 13.7% either preferred not to say, selected ‘not known’ or did not provide details; these employees are represented in sections 3.5.2, 4.6, and 4.8 of this report.
1.4
Brighton & Hove City Council publishes this information on its website.
1.5
This report relates to the snapshot date of March 31 2025.
2. Ethnicity pay and equal pay
2.1
Pay gap reporting is different from equal pay. Pay gaps measure the difference in average hourly pay between different groups.
Unlike equal pay audits, which look at the difference in pay between people with different characteristics doing the same job, pay gap reporting looks at the wider picture across the workforce.
2.2
The ethnicity pay gap measures the difference between White and BME employees' average ordinary earnings (excluding overtime) across the workforce.
It's expressed as a percentage of White employee earnings, with both the mean (average) and median hourly rates reported.
This report also details the ethnicity pay gap as a measure of the difference between Ethnic group employee average ordinary earnings (excluding overtime) across the workforce, which will be expressed as a percentage difference between each Ethnic group employee's earnings.
2.3
The Equality Act 2010 makes it unlawful to discriminate (both directly and indirectly) against employees (and people seeking work) because of their race or ethnicity.
An employer can be equal pay compliant and still have an ethnicity pay gap.
The cause of an ethnicity pay gap may not fall within the direct control of the employer and is likely to be due to other factors that impose a disadvantage on people from ethnic minorities without being explicitly discriminatory.
2.4
Brighton & Hove City Council supports the fair treatment and reward of all staff irrespective of race or other characteristics.
This report sets out Brighton & Hove City Council's ethnicity pay gap, including analysis by ethnic origins and links to our Fair and Inclusive Action Plan, which includes a comprehensive range of outputs to support the recruitment, retention and progression of BME staff.
3. Ethnicity pay gap reporting
3.1 Mean and median pay gap reporting
Brighton & Hove City Council has no median ethnicity pay gap and a positive pay gap in mean gross hourly earnings.
3.2
The median (middle) ethnicity pay gap in hourly pay is 0%. This is a decrease of 2.7% on the previous year.
3.3
The mean (average) ethnicity pay gap in hourly pay is 3.1%. This is a 1.8% decrease from the previous year.
3.4
Mean and median pay gaps between ethnic binary categories. The information below shows the mean and median pay gaps between 5 ethnic categories.
Mean and median pay gaps between 5 ethnic categories
Gap between white and Mixed, Multiple ethnic groups:
- mean 0.2%
- median -2.5%
Gap between white and Asian, Asian British:
- mean 4.9%
- median 2.6%
Gap between white and Black, Caribbean, African, Black British:
- mean 2.9%
- median 0.2%
Gap between white and Other ethnic group:
- mean 7.5%
- median 5.3%
Gap between Mixed, Multiple ethnic groups and Asian ethnic groups
- mean 4.7%
- median 5%
Gap between Mixed, Multiple ethnic groups and Black, Caribbean, African, Black British:
- mean 2.7%
- median 2.6%
Gap between Mixed, Multiple ethnic and other ethnic groups:
- mean 7.3 %
- median 7.6%
Gap between Asian, Asian British and Black, Caribbean, African, Black British:
- mean -2.1%
- median -2.5%
Gap between Asian, Asian British and other ethnic groups:
- mean 2.7%
- median 2.8%
Gap between Black, Caribbean, African, Black British and other ethnic groups:
- mean 4.7%
- median 5.2%
3.5
Salary quartile reporting is calculated by sorting employees by hourly earnings from lowest to highest, then splitting them into 4 equal quartiles to show the proportions of White and BME employees in each group.
Definitions of the salary quartile information are shown in Appendix C.
Quartile and hourly rate range table: White and BME
| Percentage of White in the quartile | Percentage of BME in the quartile | |
|---|---|---|
| Lower quartile: £8.46 to £15.58 | 88.5% | 11.5% |
| Lower middle quartile: £15.58 to £18.26 | 86.5% | 13.5% |
| Upper middle quartile: £18.26 to £21.78 | 88.4% | 11.6% |
| Upper quartile: £21.78 to £85.01 | 88.7% | 11.3% |
Quartile and hourly rate range graph: White and BME
The quartile table and graph show that in the lower quartile (hourly earning range £8.46 to £15.58), 88.5% are white, and 11.5% BME.
In the lower middle quartile (hourly range £15.58 to £18.26), 86.5% are white, 13.5% BME.
In the upper middle quartile (hourly earning range £18.26 to £21.78), 88.4% are white, 11.6% are BME.
In the upper quartile, 88.7% are white, 11.3% are BME.
3.6
Salary quartile reporting by ethnic binary categories is measured by sorting employees by their hourly rate earnings from the lowest to the highest, then splitting them into 4 equal quartiles to show the proportions of the ethnic categories (5), as well as 2 groups of employees who have reported they prefer not to say, or do not know their ethnic origin.
In total, 7 categories are included in the quartile measure. The table and graph below set out this detail.
Percentage in quartile by ethnic group
| White | Mixed, multiple ethnic groups |
Asian, Asian British |
Black, Caribbean, African, Black British |
Other ethnic group |
Not known |
Prefer not to say |
|
|---|---|---|---|---|---|---|---|
| Lower quartile: £8.46 to £15.58 | 72.2% | 2.3% | 2.9% | 2.9% | 1.5% | 15.7% | 2.6% |
| Lower middle quartile: £15.58 to £18.26 | 76.2% | 3.3% | 2.7% | 4.1% | 1.0% | 10.5% | 2.1% |
| Upper middle quartile: £18.26 to £21.52 | 76.9% | 3.3% | 3.3% | 3.1% | 1.0% | 10.1% | 2.3% |
| Upper quartile: £21.52 to £100.94 | 78.3% | 3.2% | 2.0% | 3.7% | 0.8% | 10.4% | 1.5% |
Quartile and hourly range graph by ethnic group
White employees are more represented in the upper middle and upper quartiles, with 76.9% and 78.3% of employees respectively being white, compared to 72.2% in the lower quartile.
This is a key reason behind the ethnicity pay gap, as it shows a greater proportion of white employees in higher-paid roles.
These figures are similar to those from the previous reporting period.
3.7 Bonus pay reporting
Brighton & Hove City Council does not pay bonuses, so no figures are reportable.
4. Supporting narrative and further analysis
4.1
Brighton & Hove City Council’s overall workforce ethnicity profile based on this reporting data is 3661 White and 495 BME.
4.2
4156 employees whose ethnicity is known are included in the reporting data, in addition to 559 employees whose ethnicity is not known.
These employees held 4957 job roles in the pay period, comprising 4605 contracted roles and 352 casual roles.
As per the applied reporting methodology, employees on less than full pay have been excluded.
4.3 Pay and grading
Brighton & Hove City Council’s annual pay policy statement provides details of our pay and grading arrangements and can be found via the link in Appendix C.
4.4
The mean hourly earnings for White employees were £20.12. The mean hourly earnings for BME employees were £19.49, which results in the reported 3.1% difference.
The median hourly earnings for White employees were £18.26. The median hourly earnings for BME employees were £18.26, which results in the reported 0% difference.
4.5 White British
Headline ethnicity pay gap figures comparing mean and median earnings for White British with White Irish, White Gypsy/Traveller and BME Binary categories.
Reporting the White ethnic categories individually highlights that, on average, for both the mean and median measures, White Irish employees earn more than White British, White Other and BME employees.
The median pay gap for BME employees is 0.4% when comparing earnings to White British employees, which is 0.4% higher than the reported value for the White binary category at 3.3, for which there was no pay gap.
The table below sets out the mean and median pay gaps for the same groupings.
| Ethnicity | Mean (average) hourly rate in £ | Pay gap | Median hourly rate in £ | Pay gap | Headcount (contracts) | |
|---|---|---|---|---|---|---|
| White British | 20.24 | 18.33 | 3282 | |||
| White Irish | 20.51 | -1.4% | 19.66 | -7.3% | 91 | |
| White Other, White Gypsy/Traveller | 19.00 | 6.1% | 17.94 | 2.1% | 389 | |
| BME | 19.49 | 3.7% | 18.26 | 0.4% | 512 | |
| Not known | 19.26 | 4.9% | 17.29 | 5.6% | 578 | |
| Prefer not to say | 19.36 | 4.3% | 16.96 | 7.4% | 105 |
4.6 White British pay gap (18 categories)
Mean and median hourly earnings and the percentage difference with White British employees.
Reporting the pay gaps for all ethnic origin categories provides greater detail; however, it's important to note that the group headcounts are small in size for some ethnic groups, which results in volatility of some figures.
Due to small sample sizes, figures for White and Black African, Black Other, and White - Gypsy/Irish Traveller, Pakistani and Arab ethnic groups should be treated with caution.
The data details that, on median earnings, employees with the following ethnic origins earn more than White British employees:
- White - Gypsy/Irish Traveller
- Indian
- Black–Caribbean
- Pakistani
- White–Irish
- White and Black African
- White and Black Caribbean
- White and Asian
| Mean hourly rate in £ | 2025 pay gap | Median hourly rate in £ | 2025 pay gap | Headcount | Headcount as a percentage of data | |
|---|---|---|---|---|---|---|
| White - British | 20.24 | 0.0% | 18.33 | 0.0% | 3282 | 66.2% |
| White - Gypsy/Irish Traveller | 20.13 | 0.5% | 20.14 | -9.9% | 4 | 0.1% |
| Indian | 21.78 | -7.6% | 19.66 | -7.3% | 53 | 1.1% |
| Black - Caribbean | 22.38 | -10.6% | 19.66 | -7.3% | 29 | 0.6% |
| Pakistani | 19.88 | 1.8% | 19.84 | -8.3% | 12 | 0.2% |
| White - Irish | 20.51 | -1.4% | 19.66 | -7.3% | 91 | 1.8% |
| White and Black African | 19.41 | 4.1% | 19.70 | -7.5% | 14 | 0.3% |
| White and Black Caribbean | 18.85 | 6.8% | 18.44 | -0.6% | 30 | 0.6% |
| White and Asian | 22.66 | -12.0% | 19.66 | -7.3% | 44 | 0.9% |
| Any other Asian background | 17.17 | 15.2% | 16.92 | 7.7% | 30 | 0.6% |
| Any other White background | 18.99 | 6.2% | 17.80 | 2.9% | 385 | 7.8% |
| Any other Mixed background | 19.00 | 6.1% | 18.26 | 0.4% | 63 | 1.3% |
| Black - African | 19.02 | 6.0% | 18.12 | 1.1% | 126 | 2.5% |
| Chinese | 17.20 | 15.0% | 17.28 | 5.7% | 25 | 0.5% |
| Any other Black background | 18.48 | 8.7% | 17.63 | 3.8% | 17 | 0.3% |
| Any other Ethnic background | 18.97 | 6.3% | 17.59 | 4.0% | 42 | 0.8% |
| Bangladeshi | 16.49 | 18.5% | 15.33 | 16.3% | 16 | 0.3% |
| Arab | 17.29 | 14.6% | 16.16 | 11.8% | 11 | 0.2% |
In contrast, employees with the following ethnic origins earn less than White British:
- White and Black Caribbean
- any other Mixed background
- Black – African
- any other White background
- any other Black background
- any other Ethnic background
- Chinese
- any other Asian background
- Arab
- Bangladeshi
Median hourly earnings by Ethnic origin compared to White British, sorted from highest to lowest hourly rate
White - British: 18.33
White-Gypsy/Irish Traveller: 20.14
Pakistani: 19.84
White and Black African: 19.70
Indian: 19.66
Black-Caribbean: 19.66
White-Irish: 19.66
White and Asian: 19.66
White and Black Caribbean: 18.44
Any other Mixed background: 18.26
Black-African: 18.12
Any other White background: 17.80
Any other Black background: 17.63
Any other Ethnic background: 17.59
Chinese: 17.28
Any other Asian background: 16.92
Arab: 16.16
Bangladeshi: 15.33
4.7 Wider Ethnic binary category - 5 ethnic categories
The mean White employee hourly rate is £20.12, resulting in a 0.2% pay gap for Mixed, Multiple ethnic group employees, a 4.9% gap for Asian, Asian British employees, 2.9% gap for Black, Caribbean, African, Black British employees, and a 7.5% pay gap for Other ethnic group employees.
The median White hourly rate is £18.26, resulting in a -2.5% pay gap for Mixed, Multiple ethnic group employees, 2.6% gap for Asian, Asian British employees, 0.2% gap for Black, Caribbean, African, Black British, and 5.3% gap for Other ethnic group employees.
| Ethnicity | Mean hourly rate in £ | 2025 pay gap | Median hourly rate in £ | 2025 pay gap | Headcount (contracts) |
|---|---|---|---|---|---|
| White | 20.12 | 18.26 | 3762 | ||
| Mixed, Multiple ethnic groups | 20.08 | 0.2% | 18.72 | -2.5% | 151 |
| Asian, Asian British | 19.13 | 4.9% | 17.79 | 2.6% | 136 |
| Black, Caribbean, African, Black British | 19.54 | 2.9% | 18.23 | 0.2% | 172 |
| Other ethnic group | 18.62 | 7.5% | 17.29 | 5.3% | 53 |
| Not known | 19.26 | 4.3% | 19.26 | 5.3% | 578 |
| Prefer not to say | 16.96 | 3.7% | 16.96 | 7.1% | 105 |
4.8
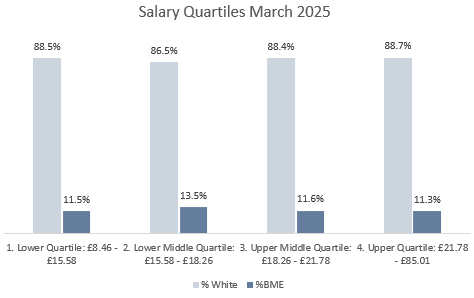
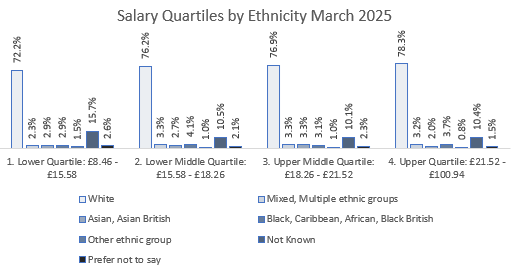
Salary quartiles for White and BME measures are shown in section 3.5.1.
The percentage of BME employees in each quartile is lower than the percentage of White employees. This reflects the workforce ethnicity profile of 11.9%.
The highest percentage representation of BME employees is at the lower middle quartile (13.5%).
There are 11.5% BME workers in the lower quartile and 11.6% in the upper middle quartile.
The upper quartile shows the lowest proportion of BME employees (11.3%).
Analysing the pay gaps within the reported pay quartiles highlights the variance of gaps across the quartiles.
| Mean/median hourly rate | White £ | BME £ | Percentage pay gap by quartile | Quartile hourly rate in £ | |
|---|---|---|---|---|---|
| Lower quartile: £8.46 to £15.58 | Mean | 14.08 | 14.17 | -0.6% | 14.03 |
| Median | 14.13 | 14.34 | -1.5% | 14.13 | |
| Lower middle quartile: £15.58 to £18.26 | Mean | 16.76 | 16.88 | -0.7% | 16.68 |
| Median | 16.93 | 16.93 | 0.0% | 16.93 | |
| Upper middle quartile: £18.26 to £21.78 | Mean | 20.07 | 20.05 | 0.1% | 19.95 |
| Median | 19.66 | 19.66 | 0.0% | 19.66 | |
| Upper middle quartile: £21.78 to £85.01 | Mean | 29.45 | 27.44 | 6.8% | 29.09 |
| Median | 25.79 | 24.22 | 6.1% | 25.79 |
The median ethnicity pay gap is highest for the upper quartile at 6.1%.
The upper middle quartile has a median pay gap of 0%.
The lower middle has a negative pay gap of -0.1%.
The lower quartile has a negative pay gap of -1.0%.
The mean ethnicity pay gap is -0.9% for the lower quartile, -0.6% for the lower middle quartile and 0.2% for the upper middle.
The upper quartile had the highest pay gap at 6.2%.
4.9
Salary sacrifice schemes are where an employee gives up the right to receive part of their salary due under their contract of employment, in return for the employer’s agreement to provide an equivalent non-cash benefit, the value of which is exempt from tax and National Insurance Contributions (NICs).
For pay gap reporting, these values must be deducted from relevant employees' pay, thus reducing the overall reportable pay to include average earnings.
Schemes include:
- Cycle to Work to help employees save on bikes purchased to commute to work
- childcare vouchers to help employees save on childcare costs
- Additional Voluntary Contribution (AVC) pension to enable Local Government Pension Scheme (LGPS) members to increase their retirement benefits by saving money alongside their pension pot
The number of employees in a salary sacrifice scheme within this data report totals 557.
8.3% are BME employees (headcount of 46) with an average monthly deduction of £188, and 81.1% are White employees (headcount 452) with an average monthly deduction of £369.
The remainder are employees of unknown ethnicity.
5. How figures compare nationally
5.1
The Office for National Statistics (ONS) last published the UK ethnicity pay gap figures for White (£12.40) and BME (£12.11) employees in 2019, with a gap of 2.3% reported. As this figure is 5 years old, we would caution against using this figure as a comparator.
Brighton & Hove City Council’s reported median pay gap is 2.3% lower at 0.0%.
The ONS no longer publish a White/BME pay gap, choosing to focus on the 5 binary categories.
The latest ONS figures published in 2022 are estimates, and these are set out below, with the variance to the council’s comparable pay gap figures detailed.
The table below shows the ONS and Brighton & Hove City Council’s 5-category median pay gap percentage figures.
| Binary category | ONS UK 2022 | Brighton & Hove & City Council 2025 | Variance of Brighton & Hove City Council to ONS |
|---|---|---|---|
| White | No reference level to compare | ||
| Asian or Asian British | -3.3 | 2.6 | 5.9 |
| Black, African, Caribbean or Black British | 5.7 | 0.2 | -5.5 |
| Mixed or multiple ethnic groups | -7.2 | -2.5 | 4.7 |
| Other ethnic group | -4.5 | 5.3 | 9.8 |
The comparison of figures shows a mixed picture, with some groups earning relatively more and others relatively less at Brighton & Hove City Council, compared with national trends.
For Asian or Asian British employees, Brighton & Hove City Council reports a positive median pay gap of 2.6%, compared with a negative -3.3% nationally, creating a 5.9 point higher gap at Brighton & Hove City Council.
For Black, African, Caribbean or Black British employees, Brighton & Hove City Council’s gap is 0.2%, which is 5.5 points lower than the national figure of 5.7%, indicating a smaller gap at Brighton & Hove City Council than at the UK level.
For Mixed or Multiple ethnic groups, Brighton & Hove City Council’s median gap of -2.5% is 4.7 points higher than the national figure of -7.2%, showing a smaller negative gap locally.
For Other ethnic groups, Brighton & Hove City Council shows a positive gap of 5.3%, compared with a -4.5% national figure, resulting in the largest variance at 9.8 points.
5.2 Reasons for the variances between ONS and Brighton & Hove City Council ethnicity pay gaps
Understanding the differences between our ethnicity pay gap figures and those reported nationally is an important part of how we learn and improve as an organisation.
These variances don’t sit in isolation; they reflect the shape of our workforce, the roles people hold and the changing context of our city.
Progress is complex, and as a council, we'll continue to carefully assess our data and listen to our colleagues.
Several factors help explain why our figures differ from the ONS picture.
The size and makeup of our workforce matter
Unlike national datasets, our numbers are much smaller, and some ethnic groups are represented by very few colleagues. This means that even small changes in recruitment or progression can shift our pay gap figures more markedly than the national trend.
Where colleagues are working across the organisation shapes outcomes
The distribution of different ethnic groups across grades and professions plays a significant role
In some areas, colleagues from particular ethnic groups are well represented in specialist or senior roles, narrowing the gap. In other areas, historical patterns of progression may still be influencing the data.
Our city’s diversity looks different to the national picture
Brighton & Hove has its own demographic profile and recruitment pipelines, which influence who applies for roles and where skills are most needed.
These local factors naturally create differences when compared with UK-wide averages.
Progression, development and retention all contribute
Where colleagues have had clear pathways to grow and develop, we see this reflected in smaller gaps. Where barriers have existed, whether visible or hidden, they can appear in the data too. This is why understanding lived experience alongside the numbers is so vital.
Our inclusion work is shifting the dial, though not always evenly
Through our Fair and Inclusive Action Plan, we're investing in meaningful change.
In some areas, we're already seeing positive movement. In others, the data shows us where further focus is needed. This is the nature of long-term work towards a fairer and more inclusive culture.
These figures come from different moments in time
The ONS data is from 2022, while our figures reflect March 2025. Over that period, our workforce has changed through recruitment, turnover and service transformation, all of which naturally influence our pay gap picture.
Together, these factors help Brighton & Hove City Council understand not just why the differences exist, but where we need to take thoughtful, sustained action.
As always, we recognise that data is only one part of the story. It must be held alongside listening, dialogue and our unwavering commitment to creating a workplace where every colleague can thrive.
5.3
Across organisations with comparable ethnicity pay gap reporting, a consistent pattern emerges: many BME colleagues remain concentrated in lower-grade roles, with limited representation at senior levels.
This reflects longstanding structural inequalities and highlights why focused, sustained action on progression and inclusion remains essential.
6. Summary and actions
6.1
Brighton & Hove City Council is confident that its ethnicity pay gap does not stem from an equal pay issue.
In 2010, we introduced a new pay and grading system to ensure all roles are graded using a recognised job evaluation system to make sure individuals receive equal pay for equal work.
In 2013, a new system of allowances and expenses was implemented to ensure consistency across the workforce.
6.2
Our ethnicity pay gap shows no difference in median earnings between White and BME colleagues, and a 3.1% mean gap. This reflects the fact that we currently have higher proportions of White colleagues in our more senior and higher-paid roles. However, we have seen representation of Black and Racially Minoritised staff in senior roles increase in the last year, which is why our ethnicity pay gap has reduced.
In reporting the pay gap for the binary groups, the figures are more mixed, as detailed in the report, with these measures providing a clearer picture.
Our focus on representation, progression and inclusion remains central to our work.
6.3
Brighton & Hove City Council is committed to building a workforce that truly reflects the diversity of our city, and ethnicity forms part of our wider inclusion agenda.
Creating a fair and inclusive place to work is one of the 5 commitments of ‘Our People Promise’ made to employees.
The work programme to deliver this promise, our co-created ‘Fair and Inclusive Action Plan’, sets out a comprehensive range of actions designed to strengthen the recruitment, retention and progression of BME staff, ensuring that opportunity is visible, accessible and real.
See Appendix E for a link to our Fair and Inclusive Action Plan.
Appendix A: Ethnicity pay reporting guidance for employers
Appendix B: Ethnic origin groupings for reporting purposes
These are in line with the Office for National Statistics (ONS) ethnicity pay gap reporting.
Ethnicity binary category: BME
This category includes:
- ethnicity groups: Asian, Asian British
- ethnic origins: any other Asian background, Bangladeshi, Chinese, Indian, Pakistani
- ethnicity groups: Black, Caribbean, African, Black British
- ethnic origins: any other Black background, Black African, Black Caribbean
- ethnicity groups: mixed, multiple ethnic groups
- ethnic origins: any other mixed or multiple background, White and Asian, White and Black African, White and Black Caribbean
- ethnicity group: other ethnic group
- ethnic origins: any other ethnic group, Arab
Ethnicity binary category: White
This category includes:
- ethnicity group: White
- ethnic origins: any other White background, White Irish, White British, White Gypsy/Irish Traveller
Appendix C: Definitions
Hourly pay definition for the purposes of calculating the mean and median hourly rates
Pay will include:
- basic pay
- paid leave, including annual leave, sick leave, maternity, paternity, adoption or parental leave (except where an employee is paid less than usual because of being on any such leave)
- area and other allowances
- shift premium pay
- pay for piecework
- bonus pay
It will not include:
- overtime pay
- allowances earned during paid overtime hours
- redundancy pay
- pay related to the termination of employment
- pay in lieu of annual leave
- any repayments of authorised expenses
- benefits in kind
- interest-free loans
Where ordinary pay is used to contribute to a salary sacrifice, the employee’s gross pay after any reduction for a salary sacrifice scheme must be used for the earnings calculation.
Full-pay relevant employee definition
“Full-pay relevant employee” means a relevant employee who is not, during the relevant pay period, being paid at a reduced rate or nil as a result of the employee being on leave.
Employees who receive no pay at all during the relevant pay period, whether or not this is as a result of being on leave, are excluded from the ethnicity pay gap calculations.
“Leave” includes—
- (a) annual leave
- (b) maternity, paternity, adoption, parental or shared parental leave
- (c) sick leave and
- (d) special leave
Pay quartiles
This calculation requires an employer to show the proportions of White and BME “full-pay relevant employees” in 4 quartile pay bands. This is done by dividing the workforce (so far as possible) into 4 equal sections to determine the lower, lower middle, upper middle and upper quartile pay bands.
Where employees receiving the same hourly rate of pay fall within more than one pay quartile, a relative proportion of BME and White employees receiving that rate of pay was assigned to each of those pay quartiles.
Appendix D: Link to our pay policy statement
Read our pay policy statement.
Appendix E: Link to the ONS ethnicity report
Appendix F: Our Fair and Inclusive Action Plan
Read our Fair and Inclusive Action Plan.