4.1
Our overall workforce gender profile is 58% female and 42% male. This is unchanged from the previous year reporting period.
4.2
4,811 employees are included in the pay period comprising of 4,484 contracted employees and 327 casuals. As per reporting requirements employees on less than full pay have been excluded (88).
4.3
The mean hourly rate of pay for male employees was £16.09. The mean hourly rate for female employees was £17.24, this results in the reported -7.2% difference. This negative gap has decreased by 0.7% since last year because the male mean hourly rate has seen a greater increase, of 40 pence, compared to the female mean hourly rate, which saw a 32 pence increase.
4.4
The median hourly rate of pay for male employees was £14.63. The median hourly rate for female employees was £15.60, this results in the reported -6.6% difference. This negative gap has decreased by 1.5% since last year because the male median hourly rate has seen a greater increase, of 61 pence, compared to the female median hourly rate, which saw an increase of 44 pence.
4.5
Male employees work on average 33.4 hours a week, with 78% of all male employees working full time, 22% part time. Female employees work on average 28.7 hours a week, with 46% of all female employees working full time and 54% part time.
The table summarises data from sections 4.1 to 4.5
| |
Male
|
Female
|
|
Workforce gender split
|
42%
|
58%
|
|
Employee count
|
2,012
|
2,799
|
|
Mean hourly rate
|
£16.09
|
£17.24
|
|
Median hourly rate
|
£14.63
|
£15.60
|
|
% of employees who work part time
|
22%
|
54%
|
|
% of employees who work full time
|
78%
|
46%
|
|
Average weekly hours for all employees
|
33.4
|
28.7
|
|
Average weekly hours for part time employees
|
21.6
|
22.3
|
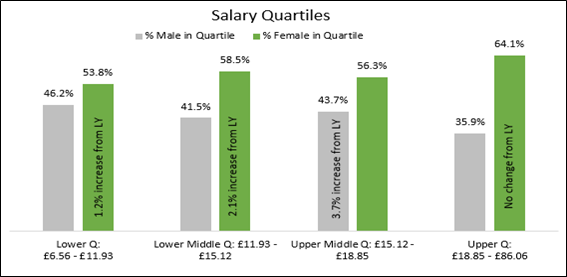
4.6
Salary quartiles
The % of female employees in each quartile is higher than the % of men. This is in line with the overall workforce gender profile, however, the % gap between the number of men and women in each quarter significantly widens between the 2 lower quartiles and 2 higher quartiles. The lower quartile has 7.6% more women than men, the upper quartile has 28.3% more women than men. This shows that a greater proportion of women hold roles which have a higher mean hourly rate of pay than men.
There are various job roles within each quartile and the proportion of male and female employees in each role differs.
Below are some examples.
Lower quartile
|
Domestic Assistant
|
70% female
|
|
Library Officer
|
62% female
|
|
Customer Services Officer
|
73% female
|
|
Collection Operative
|
95% male
|
|
Housing Estates Assistant
|
91% male
|
Lower middle quartile
|
Early Years Educator
|
100% female
|
|
Community Family Worker
|
92% female
|
|
Home Care Support Worker Home Care
|
87% female
|
|
Maintenance Technician
|
100% male
|
|
Street Cleansing Driver
|
96% male
|
Upper middle quartile
|
Social Worker (PQ1)
|
72% female
|
|
Care Manager
|
81% female
|
|
Occupational Therapist
|
77% female
|
|
Collection Driver Supervisor
|
95% male
|
|
Performance Analyst
|
55% male
|
Upper quartile
|
Senior Social Worker
|
82% female
|
|
Team/Pod Manager
|
80% female
|
|
Assistant Director
|
73% female
|
|
Head of Service or Department
|
56% female
|
|
Accountant
|
50% male
|
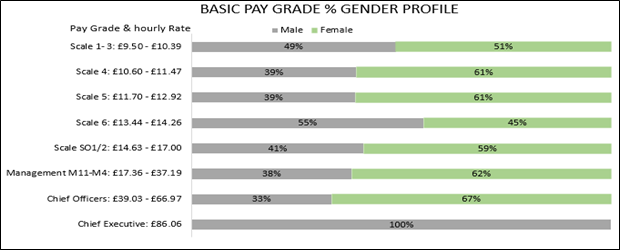
4.7
Basic pay
Reviewing the main basic pay grades for job roles shows a similar pattern, a larger proportion of female employees hold higher paid roles, particularly on management grades where 62% of roles are held by women. Similarly, 59% of all roles with basic hourly rates over £11.70 (£11.70 to £86.06) are held by women. In contrast 45% of all roles with lower basic hourly rates between £9.50 and £11.47, are held by men.
What the basic pay graph means
The graph shows the proportion of male and female employees on the main council pay grades.
Proportionately a higher % of female employees hold roles on the higher basic pay grades.
For example, 62% on the council’s management pay grades between M11 and M4 are female, with hourly rates between £17.36 and £37.19.
You can also view this data in a table.
Basic pay grade % gender profile
|
Pay grade and hourly rate
|
Male
|
Female
|
|
Scale 1 to 3: £9.50 to £10.39
|
49%
|
51%
|
|
Scale 4: £10.60 to £11.47
|
39%
|
61%
|
|
Scale 5: £11.70 to £12.92
|
39%
|
61%
|
|
Scale 6: £13.44 to £14.26
|
55%
|
45%
|
|
Scale SO1/2: £14.63 to £17.00
|
41%
|
59%
|
|
Management M11 to M4: £17.36 to £37.19
|
38%
|
62%
|
|
Chief Officers: £39.03 to £66.97
|
33%
|
67%
|
|
Chief Executive: £86.06
|
100%
|
0%
|
4.8
Pay and grading
Our annual pay policy statement provides details of our pay and grading arrangements.
4.9
Allowances
28% of the workforce in the snapshot pay period received an allowance in addition to their basic pay, this is a 1% increase from 2021. Analysis by quartile of the mean and median hourly rates for employees in receipt of an allowance show that with the exception of the lower quartile, the mean and median hourly rates of female employees are consistently higher.
4.10
Working patterns
A further contributing factor to the pay gap is the working pattern of an employee. Roles where hours are worked at the weekend and night attract enhanced rates of pay, 21% of the workforce receive such enhancements. While proportionally more men receive working pattern allowances than women, the basic hourly rate of roles held by men are proportionally lower than the roles held by women. The higher basic hourly rated pay for roles held by women in addition to the enhanced rate of pay increases the mean and median hourly rates of pay for women.
|
Basic hourly rate range
|
Proportion of gender in receipt of working pattern allowances by hourly rate %. Extract.
|
|
|
|
Male %
|
Female %
|
|
£9.50 to £10.21
Pay Scale 1 to 2 and Scale 3
|
57%
|
43%
|
|
£10.41 to £16.71
Pay Scale 4 to S01/2
|
47%
|
53%
|
4.11
Market supplements
60% of employees in roles attracting a market supplement are women, 40% are men. This is a 10% increase for male employees compared to 2021. Market Supplements are subject to annual review.
4.12
Salary sacrifice
Salary sacrifice is where an employee gives up the right to receive part of their salary due under their contract of employment, in return for the employer’s agreement to provide an equivalent non-cash benefit, the value of which is exempt from tax and national insurance contributions (NICs).
Schemes include:
- Cycle to Work to help employees save on bikes purchased to commute to work
- Childcare vouchers - to help employees save on childcare costs.
- Additional Voluntary Contribution (AVC) Pension – enables Local Government Pension Scheme (LGPS) members to increase their retirement benefits by saving money alongside their pension pot.
7% of the qualifying workforce are signed up to a salary sacrifice scheme.
| |
Male
|
Female
|
Variance to previous reported year 2022 to 2021
|
|
Number of employees in a salary sacrifice scheme
|
124
|
205
|
The percentage of male employees in a salary sacrifice scheme increased by 4% and 6% for female employees. Overall a 5% increase
|
|
Average monthly employee salary sacrifice amount
|
£263
|
£286
|
The value of monthly salary sacrifice for female employees in a scheme increased by 31%, and decreased by 11% for male employees
|
For the purposes of gender pay gap calculations these values must be deducted from relevant employees pay, thus reducing the overall reportable pay to include for averaging.