1. Introduction
1.1
The Equality Act 2010 (Specific Duties and Public Authorities) Regulations 2017 require all public and private sector employers with more than 250 employees to report their gender pay gap based on an annual ‘snapshot’ pay period. For the public sector, this snapshot is 31 March each year.
The reporting regulations require publication of the following:
- the mean and median gender pay gaps in hourly pay
- the mean and median gender bonus gaps
- the proportion of men and women who received bonuses
- the proportions of men and women employees in each pay quartile
1.2
The reporting data includes all Brighton & Hove City Council employees who were employed on 31 March.
Apprentices, seasonal, temporary or casual employees are included if they fall within the reference period created by the snapshot date.
The data excludes school-based staff. Under the Regulations, the Governing Body of maintained Local Authority schools is responsible for the reporting duty for the employees of their school, where the regulations apply.
1.3
Brighton & Hove City Council publishes this information on the webpage staff pay and conditions financial information, and GOV.UK's Gender Pay Gap Service.
1.4
This report relates to the snapshot date of March 31 2025.
2. Gender pay and equal pay
2.1
Gender pay is different from equal pay.
Equal pay means that men and women in the same employment performing work of equal value must receive the same salary and have equal contractual terms, as set out in the Equality Act 2010.
The gender pay gap is a measure of the difference between men’s and women’s average ordinary earnings (excluding overtime) across an organisation or the labour market. It is expressed as a percentage of men’s earnings. Both the mean (average) and median hourly rates are reported.
An employer can be equal pay compliant and still have a gender pay gap. The cause of a gender pay gap may not fall within the direct control of the employer, and is likely caused by the distribution of men and women in different job roles.
3. Gender pay gap reporting
3.1 Mean and Median pay gap reporting
Brighton & Hove City Council has a negative pay gap for both the mean and median gross hourly rates. This is not uncommon, but it goes against the overall national trend.
3.2.1
The mean (average) gender pay gap in hourly pay is -7.9%. This is a 0.7% negative increase to the 2024 reported figure 7.2%.
3.2.2
The median (middle) gender pay gap in hourly pay is -6.8%. This is a 3.8% negative increase on the 2024 figure, -3.0%
3.3
Salary quartile reporting is calculated by sorting employees by their hourly rate, from the lowest to the highest, then splitting them into 4 equal quartiles to show the proportions of male and female employees in each group.
Definitions of the salary quartile information are shown in Appendix A.
What the salary quartile graph means
The lower salary quartile includes the average hourly earning rates between £8.46 (apprentice pay rate) and £15.58. The proportions of employees in the quartile is 45.0% male, 55.0% female. This is a 1.4% increase in the number of females in the quartile compared to last year’s reporting.
Brighton & Hove City Council’s lowest pay rate as of March 2024 was £13.26.
The lower middle quartile includes hourly rates between £15.58 and £18.26. The quartile is 43.9% male, 56.1% female. This is a 1.6% increase in males in the quartile compared to last year.
The upper middle quartile includes hourly rates between £18.26 and £21.52. The quartile is 41.1% male, 58.9% female. This is a 1.3% decrease in males in the quartile compared to last year.
The upper quartile includes hourly rates between £21.52 and £100.94. The quartile is 34.5% male, 65.5% female. This is a 1.4% increase in females in this quartile compared to last year.
You can also view this data in the table below.
| Male | Female | Change to last year year's reporting | |
|---|---|---|---|
| 1. Lower Quartile: £8.46 to £15.58 | 45.0% | 55.0% | 1.4% female increase |
| 2. Lower Middle Quartile: £15.58 to £18.26 | 43.9% | 56.1% | 1.6% male increase |
| 3. Upper Middle Quartile: £18.26 to £21.52 | 41.1% | 58.9% | 1.3% female increase |
| 4. Upper Quartile: £21.52 to £100.94 | 34.5% | 65.5% | 1.4% female increase |
3.4
Bonus pay reporting. These figures are not applicable as Brighton & Hove City Council does not pay bonuses.
4. Supporting narrative
4.1
Brighton & Hove City Council’s overall workforce gender profile is 59% female and 41% male. This is a 1% increase in female employees compared to last year.
4.2
4,813 employees are included in the reporting data. These employees hold 4,957 job roles in the pay period, comprising 4,510 contracted roles and 303 casual roles.
As per reporting requirements, employees on less than full pay have been excluded (89).
4.3
The mean hourly rate of pay for male employees was £19.05. The mean hourly rate for female employees was £20.56, which results in the reported -7.9% difference. This negative gap has increased by 0.7% since last year.
4.4
The median hourly rate of pay for male employees was £17.49. The median hourly rate for female employees was £18.68, which results in the reported -6.8% difference. This negative gap has increased by 3.8% since last year.
4.5
Male employees work on average 33.1 hours a week, with 79% of all male employees working full time, 21% part time.
Female employees work on average 28.5 hours a week, with 48% of all female employees working full-time and 52% part time.
| Male | Female | |
|---|---|---|
| Workforce gender split | 41% | 59% |
| Employee count | 2039 | 2918 |
| Mean hourly rate | £19.05 | £20.56 |
| Median hourly rate | £17.49 | £18.68 |
| Percentage of employees who work part time | 21% | 52% |
| Percentage of employees who work full time | 79% | 48% |
| Average weekly hours for all employees | 33.1 | 28.5 |
| Average weekly hours for part time employees | 18.0 | 20.7 |
This table summarises data from sections 4.1 to 4.5.
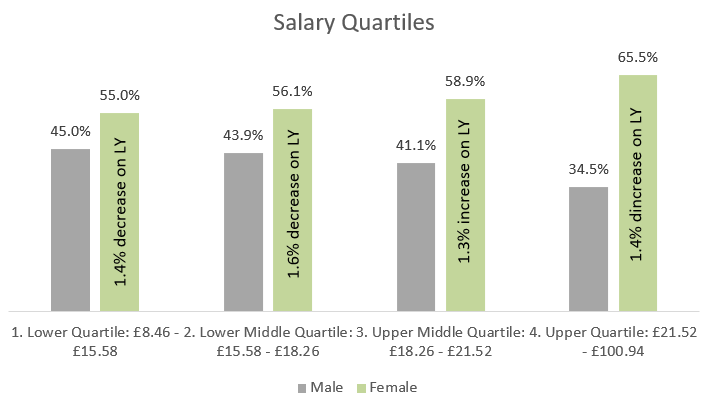
4.6 Salary quartiles
The percentage of female employees in each quartile is higher than the percentage of men. This is in line with the overall workforce gender profile; however, the percentage gap between the number of men and women in each quarter significantly widens between the 2 lower quartiles and the 2 higher quartiles.
The lower quartile 55% women and 45% men, a percentage difference of 10%, whereas the upper quartile contains 65.5% women compared to 34.5% men, a percentage difference of 31%.
Lower quartile
Examples of jobs in the lower quartile include:
- Home Improvement Officer: 57% female
- Information Officer: 54% male
- Nursery Administrator: 83% female
- Collection Operative: 98% male
- Library and Information Officer: 60% female
Lower middle quartile
Examples of jobs in the lower middle quartile include:
- Performance Analyst: 54% male
- Plumber: 88% male
- Collection Driver Supervisor: 92% male
- Move On Officer: 70% female
- Business Support Manager: 92% female
Upper middle quartile
Examples of jobs in the upper middle quartile include:
- Social Worker (Newly Qualified): 83% female
- Adolescent Worker: 82% female
- Senior Technician: 86% male
- Communications Officer: 67% female
- Operation Support Manager: 67% male
Upper quartile
Examples of jobs in the upper quartile include:
- Senior Technical Consultant: 80% male
- Principal Planning Officer: 71% female
- Practice Manager: 78% female
- AMHP Senior Social Worker: 80% female
- General Manager: 80% male
4.7 Basic pay
Reviewing the main basic pay grades for job roles shows a similar pattern: a larger proportion of female employees hold higher-paid roles, particularly on management grades, where women hold 63% of roles.
Similarly, 60.1% of all roles with basic hourly rates over £14.60 (£14.60 to £100.94) are held by women.
46.1% of all roles with lower basic hourly rates between £13.26 and £14.36 are held by men.
What the basic pay graph means
The graph shows the proportion of male and female employees on the main council pay grades.
Proportionately, a higher percentage of female employees hold roles in the higher basic pay grades. For example, 63% on Brighton & Hove City Council’s management pay grades between M11 and M4 are female, with hourly rates between £20.02 and £40.66.
You can also view this data in the table below.
| Pay grade and hourly rate | Male | Female |
|---|---|---|
| Scale 3: £13.26 to £13.47 | 67.2% | 32.8% |
| Scale 4: £13.69 to £14.36 | 38.3% | 61.7% |
| Scale 5: £14.60 to £15.58 | 41.4% | 58.6% |
| Scale 6: £16.10 to £16.93 | 52.0% | 48.0% |
| Scale SO1/2: £17.29 to £19.66 | 37.5% | 62.5% |
| Management M11-M4: £20.02 to £40.66 | 37.0% | 63.0% |
| Chief Officers: £41.98 to £85.01 | 35.3% | 64.7% |
| Chief Executive: £100.94 to £100.94 | 0.0% | 100.0% |
4.8 Pay and grading
Brighton & Hove City Council's annual pay policy statement provides details of the council’s pay and grading arrangements.
4.9 Allowances
30% of the workforce in the snapshot pay period received an allowance in addition to their basic pay; this is a 1% increase from 2024.
Analysis by quartile of the mean and median hourly rates for employees in receipt of an allowance shows that, with the exception of the lower quartile, the mean and median hourly rates of female employees are consistently higher.
4.10 Working patterns
A further contributing factor to the pay gap is the working pattern of an employee.
Roles where hours are worked at the weekend and night attract enhanced rates of pay, 19.2% of the workforce receive such enhancements.
While more women receive working pattern allowances than men, the basic hourly rate of roles held by men is proportionally lower than the roles held by women. For example:
- 48% of employees in receipt of working pattern allowances are men, 52% are women
- 11% of recipients are male on scale 3, compared to 6% who are female
Moving up the pay grade, 13% of recipients of an enhancement on scale 4 are male, and 25% are female.
4.11 Market supplements
70% of employees in roles attracting a market supplement are women, 30% are men. This is a 3% decrease for male employees compared to 2024.
Market supplements are subject to annual review.
4.12 Salary sacrifice
Salary sacrifice is where an employee gives up the right to receive part of their salary due under their contract of employment, in return for the employer’s agreement to provide an equivalent non-cash benefit, the value of which is exempt from tax and national insurance contributions (NICs).
Schemes include:
- Cycle to Work, which helps employees save on bikes purchased to commute to work
- childcare vouchers, which help employees save on childcare costs
- Additional Voluntary Contribution (AVC) Pension, which enables Local Government Pension Scheme (LGPS) members to increase their retirement benefits by saving money alongside their pension pot
7% of the qualifying workforce are signed up to a salary sacrifice scheme.
Number of employees in a salary sacrifice scheme
Male: 220.
Female: 347.
Variance from the previous reported year 2023 to 2024: The percentage of male employees in a salary sacrifice scheme increased by 16%, and by 19% for female employees. Overall, an 18% increase.
Average monthly employee salary sacrifice amount
Male: £343.
Female: £329.
Variance from the previous reported year 2023 to 2024: The value of monthly salary sacrifice for male employees in a scheme decreased by 10%, and by 1% for female employees, decreasing overall by 6%.
For the purposes of gender pay gap calculations, these values must be deducted from relevant employees' pay, thus reducing the overall reportable pay to be included for averaging.
5. Conclusions and Action Plan
5.1
Brighton & Hove City Council is confident that its gender pay gap does not stem from an equal pay issue.
In 2010, the council introduced a new pay and grading system to ensure all roles are graded using a recognised job evaluation system to make sure individuals receive equal pay for equal work.
In 2013, a new system of allowances and expenses was implemented to ensure consistency across the workforce.
5.2
Brighton & Hove City Council’s gender pay gap shows that, on average (by both measures), female employees are paid more than male employees, and this is the opposite of the national gender pay gap.
The Office for National Statistics (ONS) reported a UK median gender pay gap of 12.8% in April 2025, down from 13.1% in 2024.
Brighton & Hove City Council’s mean and median pay gaps are both lower than the national average. This is because we have more female employees in higher-grade posts.
5.3
Brighton & Hove City Council appreciates that a negative gender pay gap bucks the national trend and is clear that any pay gap signals inequality that must be understood and addressed.
Our commitment goes beyond gender alone. We are striving to build a workforce that truly reflects the diversity of our communities, and gender is one important part of that wider ambition.
We are also deepening our understanding of our data through an intersectional lens, so we can better identify and respond to any disproportionate outcomes. This helps ensure that our actions are informed, equitable and focused on creating a workplace where everyone can thrive.
5.4
The gender profile of the workforce remained similar between reporting years, with the majority of employees being female.
Brighton & Hove City Council’s upcoming 2024 to 2025 publication on statutory workforce equalities notes that women are more successful at being shortlisted and hired across all pay grades and contract types. This is a 5+ year trend. The data also showed that females (60.2%) gained promotions at a higher rate than their proportion in the workforce.
5.5
There are a number of factors that enable the council to continue to build a workplace where women, and all our employees, can grow, lead and feel supported at every stage of their careers. This is reflected in the practical support we offer, the way we shape our culture and the behaviours we champion every day.
These include the following:
Family-friendly working that meets real life
Flexible working arrangements, occupational, maternity and parental leave, carers and special leave, and childcare vouchers help ensure that our employees do not have to choose between their careers and their caring responsibilities.
Wellbeing support that recognises lived experience
Brighton & Hove City Council offers menopause guidance, tailored wellbeing resources and informative training for both employees and managers. This helps build understanding, reduces stigma and ensures women feel supported at work through life’s transitions in a healthy and psychologically safe workplace.
Development that opens doors and builds confidence
Brighton & Hove City Council’s Learning Organisation Framework helps to enable a workforce that is connected, confident, innovative and inclusive, and able to work in a healthy and psychologically safe way.
Our learning and development offer, including training on inclusive practice and inclusive recruitment, helps create pathways for everyone to progress, lead and shape the organisation. It ensures everyone, whatever their background or role, has opportunities to grow.
5.6
As part of the Public Sector Equality Duty, Brighton & Hove City Council carries out regular equality monitoring in respect of the following aspects of employment:
- workforce composition
- recruitment and retention
- employment casework
- learning and development
- employee satisfaction for current staff via the annual staff survey, and for staff who leave our employment
5.7
The data noted above in section 5.6 is used to prioritise actions to address any disproportionate outcomes identified for different staff groups through our Fair and Inclusive Action Plan.
Data is reviewed annually with stakeholders to support the delivery of our People Promise commitment to be a fair and inclusive place to work.
Continued activity for years 2024 to 2027 includes:
- review where there's an imbalance in the gender profile of staff in particular job roles, and agree on actions to attract and retain staff from under-represented groups
- engagement with community groups and schools, working alongside our Apprenticeship Programme Manager to raise the profile of Brighton & Hove City Council as a potential employer, and showcase a range of roles challenging gender bias within sectors
- participation in the LGA flagship campaign to encourage people to consider jobs at councils
- actions to increase diversity across the workforce as a whole, with a particular focus on roles graded M8 and above
- continue to voluntarily publish annual ethnicity and disability pay gap reports in line with the gender pay gap reporting schedule
Read the latest staff pay gap reports.
An update on the progress and impact of these actions will be reported in the annual workforce equalities report for the reporting period 1 April 2025 to 31 March 2026, to be published by March 30 2026.
5.8
Services and directorates monitor their workforce profiles and respond to data to inform actions they can take, including with respect to workforce diversity and pay.
Appendix A - definitions
Hourly pay definition for the purposes of calculating the mean and median hourly rates
Pay will include:
- basic pay
- paid leave, including annual leave, sick leave, maternity, paternity, adoption or parental leave (except where an employee is paid less than usual because of being on any such leave)
- area and other allowances
- shift premium pay
- pay for piecework
- bonus pay
It will not include:
- overtime pay
- expenses
Full-pay relevant employee definition
“Full-pay relevant employee” means a relevant employee who is not, during the relevant pay period, being paid at a reduced rate or nil as a result of the employee being on leave.
Employees who receive no pay at all during the relevant pay period, whether or not this is as a result of being on leave, are excluded from the gender pay gap calculations.
“Leave” includes:
- (a) annual leave
- (b) maternity, paternity, adoption, parental or shared parental leave
- (c) sick leave and
- (d) special leave
Pay quartiles
This calculation requires an employer to show the proportions of male and female “full-pay relevant employees” in 4 quartile pay bands. This is done by dividing the workforce (so far as possible) into 4 equal sections to determine the lower, lower middle, upper middle and upper quartile pay bands.
Where employees receiving the same hourly rate of pay fall within more than one pay band quartile, a relative proportion of male and female employees receiving that rate of pay was assigned to each of those pay quartiles.