What is Age and Dementia Friendly Brighton & Hove
Brighton & Hove City Council have an ambition for Brighton & Hove to be an Age and Dementia Friendly city.
We have a local programme working to build a city where everyone can be supported to age well and keep doing the things they enjoy.
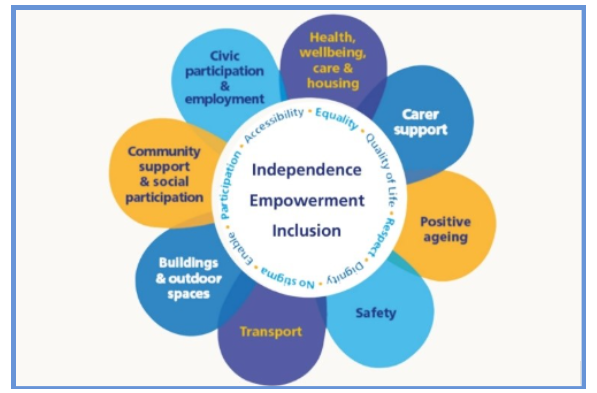
We're working with partners across the city to improve residents’ lives in 8 key areas:
- Community support and social participation.
- Civic participation and employment.
- Health, wellbeing, social care and housing.
- Built environment and outdoor spaces.
- Transport.
- Carer support.
- Safety.
- Positive Ageing.
Figure 1. Brighton & Hove’s Age & Dementia Friendly eight domains
Brighton & Hove’s older population
Brighton & Hove has an ageing population, with more than 39,100 residents over 65 (Census 2021) and an estimated 2,900 people living with dementia (NHS Primary Care Dementia Data, 2025).
The number of people aged 50 to 74 increased by 28% between 2011 and 2021 - the largest rise of any age group - while the overall population grew by just 1.4% (Census 2021).
Among residents aged 66 and over, 38% live alone, a higher proportion than regional and national averages.
In addition, 22% of people aged 60+ are income-deprived, compared with 19% in England and 13% in the South East (Brighton & Hove Indices of Deprivation, 2025).
Age and Dementia Friendly Brighton & Hove survey
In October 2024, Age and Dementia Friendly Brighton & Hove launched a city‑wide survey based on its 8 domains, which ran from 14 October 2024 to 6 January 2025.
The survey aimed to capture local people’s personal views and lived experiences to better understand the issues we may face as we age in Brighton & Hove. The survey is not an evaluation of service performance.
The survey was available:
- online
- in paper format at:
- libraries
- seniors housing schemes
- Hop 50+
- Alzheimer’s Society
- the Carers Centre
All responses were anonymous, and all questions were voluntary.
Feedback was analysed using quantitative and qualitative methods by the Age and Dementia Friendly Public Health Specialist.
AI tools (Copilot and Dovetail) were used to support thematic analysis, and the analysis was validated by the Public Health Intelligence Team.
For ease of understanding, all numbers in this report have been rounded to the nearest whole number. Overall, only feedback from 3 or more respondents has been reported, except in a few cases where feedback from fewer people was considered important to include.
Findings have informed the city’s Age and Dementia Friendly Action Plan to help make Brighton & Hove a great place to live and grow older, and have been fed back to relevant teams.
This briefing gives a high-level summary of key findings from the survey.
Highlights of survey analysis
The highlights of survey analysis include:
- 257 participants took part in the survey
- 78% (201) of surveys were completed online, and 22% (56) were paper copies
- 66% female, 25% male, 2% other, 1% non-binary respondents took part in the survey (6% provided no answer)
- ages of respondents range from the 20s to the 90s:
- 14% of respondents are aged 65 to 69
- 21% of respondents are aged 70 to 74
- 19% of respondents are aged 75 to 79
- 93% of respondents are not living with dementia, and 7% are living with dementia
- respondent’s day-to-day activities are limited due to a health problem/disability, a little (30%) and a lot (27%)
- participants live:
- 51% of respondents live alone
- 27% of respondents live with someone who is not their carer
- 10% of respondents live with someone who is their carer
- 11.1% of respondents live elsewhere (other)
- 1% of respondents live in a care home
- of the respondents:
- 81% are White
- 8% are White Other
- 2% are Other Ethnic Groups
- 2% are Mixed Asian and White
- 1% are Mixed Background
- 1% are White Irish
- 1% are Black/Black British: Caribbean
- 1% are Other Ethnic Group: Arab
For further survey demographics, see Appendix 1.
Thematic analysis
Thematic analysis identified 3 cross-cutting themes across the domains, highlighting opportunities to improve inclusion and increase participation among older people in the city.
1. Digital exclusion and difficulty finding information
Some respondents report challenges finding clear, accessible information about activities, events and services.
Common issues include:
- reliance on digital communication
- limited availability of printed or alternative formats
- few options to speak with someone directly for support
2. Access to public spaces, buildings and activities
Some respondents note that older people, people living with dementia, carers and those with mobility or sensory requirements can face barriers when moving around the city or taking part in community life.
Frequently mentioned issues include:
- uneven pavements
- limited accessible toilets and seating
- reduced public transport in some areas
- inaccessible buildings
- public spaces that could be better maintained
- difficulties parking, including limited disabled spaces
3. Understanding of ageing and accessibility
Some respondents feel there's a limited awareness of the needs of older people and those living with dementia among professionals and the wider public. Examples include:
- challenges with citywide design and accessibility
- reliance on digital services
- varying levels of professional and public awareness around ageing and disability
Some also feel their views are not always considered in local policies or when raising concerns about public spaces.
Some respondents describe experiencing disrespectful behaviour from the public, businesses, professionals and in the workplace.
Within these 3 themes, 10 priority needs for older people and people living with dementia were identified.
Top 10 identified needs for older people and people living with dementia in the city
1. Widely publicised, reliable, accessible information about activities, events and services.
2. Improved citywide accessibility to support equitable access to public buildings.
3. A diverse range of accessible and affordable activities.
4. Accessible information on support to stay at home and housing options.
5. Support for passengers to board and alight public transport safely and easily.
6. Intergenerational programmes/spaces to support mutual respect across generations.
7. Accessible toilets that are available for public use.
8. Improved bus links to certain parts of the city.
9. Increased opportunities for older people to take part in their community.
10. Enough outdoor seating as resting places in public spaces.
Survey results: Outdoor spaces and public buildings
Access to public buildings
Over 60% of respondents feel Brighton & Hove has the shops and services they need (Appendix 2), and nearly 60% agree that public buildings such as libraries and leisure centres are accessible (Figure 1).
Figure 1: Respondents' views on the accessibility of Brighton & Hove's public buildings (such as libraries and leisure centres)
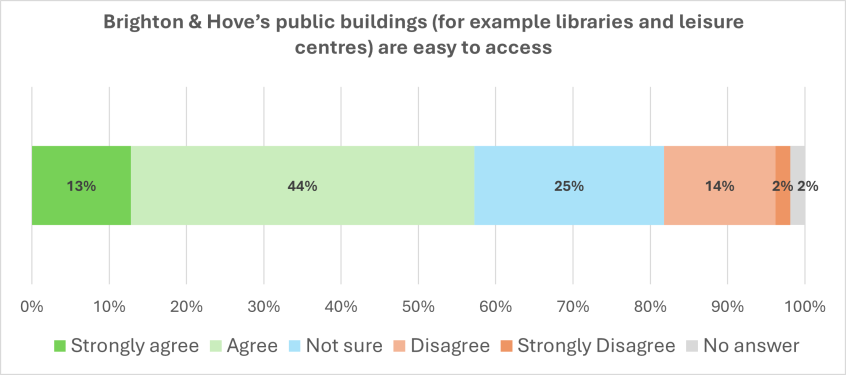
Brighton & Hove's public buildings (for example, libraries and leisure centres) are easy to access:
- strongly agree: 13%
- agree: 44%
- not sure: 25%
- disagree: 14%
- strongly disagree: 2%
- no answer: 2%
Among those who disagree, 45 respondents mention factors that make access more difficult, including:
- uneven pavements
- limited accessibility features such as ramps or lifts
- public spaces that could be better maintained
- a lack of disabled parking spaces
Twelve respondents note that these issues may especially affect older people, people living with dementia and wheelchair users.
A full list of reported barriers is provided in Table 11, Appendix 2.
"Generally, there are public toilets and libraries and outdoor spaces available however, if mobility is an issue, it can be hard to access them” - quote from respondent
Accessible public toilets
Most respondents (68%) feel there are not enough public toilets in the city (Figure 2). Thirty-three people mention a lack of accessible toilets, and 13 note that this can be a barrier for some groups, including people with health conditions such as diabetes, which may reduce confidence in using public spaces.
Seven respondents also mention reduced access due to closures or limited opening hours, and 5 raise concerns about cleanliness and maintenance.
“Definitely need more public toilets - lack of public conveniences means I do not like to go too far in case I "am in need" of the loo!” - quote from respondent
Figure 2: Respondents' views on the number of accessible toilets in the city
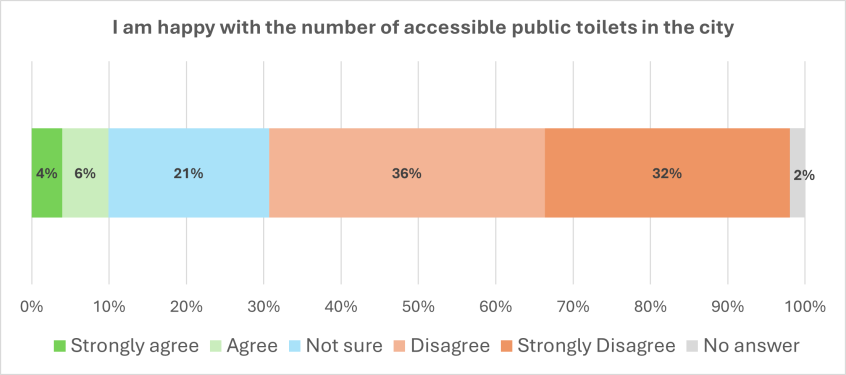
I'm happy with the number of accessible public toilets in the city:
- strongly agree: 4%
- agree: 6%
- not sure: 21%
- disagree: 36%
- strongly disagree: 32%
- no answer: 2%
Public benches
Nearly half of respondents (47%) are dissatisfied with the availability of public benches and rest areas, while 28% are satisfied (Figure 11, Appendix 2).
Eighteen respondents feel there's not enough seating in many parts of the city, with 5 noting this may particularly affect certain groups (see cross-cutting themes).
Seven respondents also mention concerns about the condition of some benches and their use by street drinkers.
“We need more outdoor seats in town, shopping is very hard when you are elderly” - quote from respondent
Parks and open spaces
The majority of respondents (66%) agree that parks and open spaces are easy to access (Figure 12, Appendix 2). Three respondents praise the quality and quantity of the city’s parks.
“I think we're fortunate in Brighton & Hove in having a number of lovely parks” - quote from respondent
Three respondents mention limited access to parks and open spaces in some parts of the city. Eight highlight accessibility challenges for wheelchair users and people with mobility requirements, and 7 raise concerns about the maintenance and cleanliness of parks and related facilities.
A further 5 respondents note that transport links to parks can be limited.
“A lot of open spaces are limited to more mobile people” - quote from respondent
Survey findings: Public transport
Public transport
Brighton & Hove has 3 public transport providers:
- Brighton & Hove Buses
- Stagecoach
- Compass
Big Lemon Buses was also operating at the time of the survey.
Public transport and travel needs
The majority (72%) of respondents agree that public transport in Brighton & Hove gets them where they want to go (Figure 13, Appendix 2). Seventeen strongly praise the bus service, describing it as excellent and reliable.
“The bus service is the best in the country.” - quote from respondent
Nineteen respondents suggest improving bus links across the city, particularly by introducing more direct routes between outer areas to reduce travel times.
Fifteen respondents also feel that current routes can make it difficult for people with mobility requirements to reach key destinations such as the central seafront, some GP practices, parks, housing estates and tourist attractions.
“We need more buses going directly across town, avoiding Churchill Square” - quote from respondent
The convenience of public transport in my local area
The majority of respondents (74%) feel that public transport is convenient to where they live (Figure 14, Appendix 2). However, 14 respondents would like more frequent and reliable bus services, with 5 noting this is particularly important in outer areas of the city.
Three respondents also suggest introducing a community bus service in areas with higher demand.
Public transport accessibility
The majority (70%) of respondents agree that they can get on and off public transport easily (Figure 3).
Figure 3: Respondents' views on the accessibility of public transport
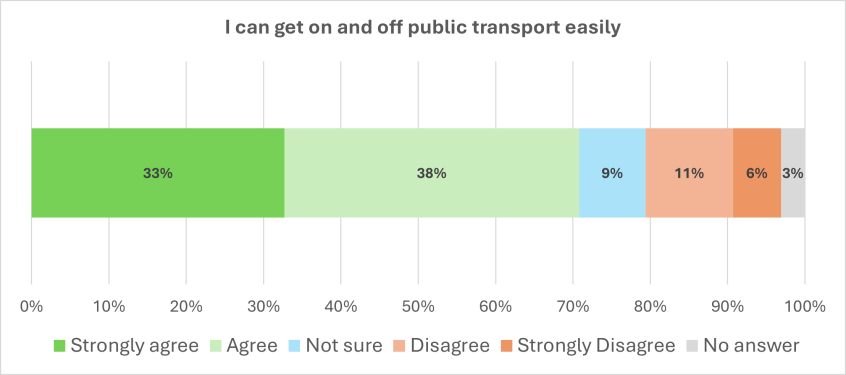
I can get on and off public transport easily:
- strongly agree: 33%
- agree: 38%
- not sure: 9%
- disagree: 11%
- strongly disagree: 6%
- no answer: 3%
Experiences with driver behaviour and bus accessibility vary. Nine respondents describe positive experiences, noting helpful bus drivers, supportive passengers, and good accessibility features, while 14 find some drivers less supportive of disabled and older passengers.
“It appears from their behaviour that they [bus drivers] have been trained to consider the needs of mobility impaired passengers and those with other impairments. Hooray!” - quote from respondent
"Some drivers are considerate some might need signs to remind them” - quote from respondent
Thirty-six respondents, including older and disabled passengers, report challenges when boarding and getting off buses, including:
- limited time to reach a seat
- buses not always pulling close enough to the kerb or being lowered
- overcrowding affecting essential trips
- longer distances between bus stops
Fifteen respondents also mention other barriers to using public transport, such as:
- high fares
- time restrictions on older persons’ bus passes, limiting travel for those living in outer areas
- concerns about cleanliness and hygiene awareness, and uncomfortable journeys
Six respondents note that they are unable to use public transport due to disability and therefore rely on taxis for essential journeys. Two also report difficulties booking or accessing wheelchair accessible taxis.
A full list of challenges when boarding or exiting the bus is listed in Table 12, Appendix 2.
Crossing the road at pedestrian/zebra crossings
Over half of respondents (53%) agree that pedestrian crossings provide enough time to cross (Figure 15, Appendix 2). Four respondents also mention a lack of crossings in some areas, and 3 note that green man signals can be difficult to see.
Survey findings: Health and social activities
Availability of events and activities
Almost two-thirds of respondents (59%) feel there's a good range of activities in the city (Figure 4).
Twenty respondents gave positive feedback about local events and activities, with several highlighting services such as:
- Hop 50+
- the Hangleton & Knoll Project
- South East Dance
- Sporting Memories
- Walking the Talk Wednesdays
- Seniors Housing
"That's why I live here, there is lots to do.” - quote from respondent
Figure 4: Respondents’ views on the range of events and activities in Brighton & Hove
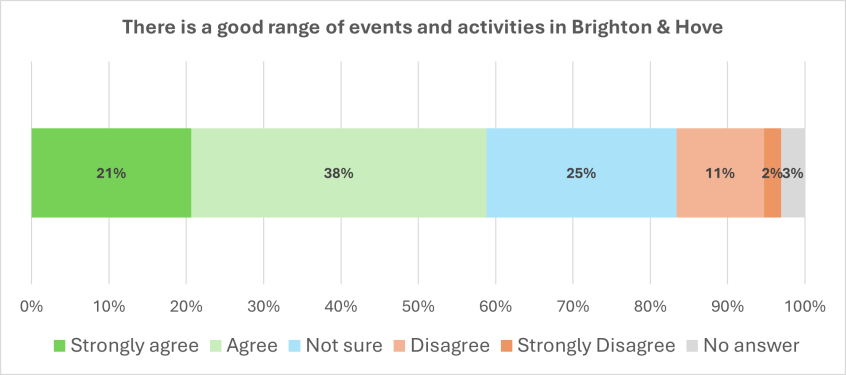
There's a good range of events and activities in Brighton & Hove:
- strongly agree: 21%
- agree: 38%
- not sure: 25%
- disagree: 11%
- strongly disagree: 2%
- no answer: 3%
However, 38% are unsure or disagree, with 14 respondents feeling that local activities are not well publicised.
“There are good directories but some of my older friends haven't been as aware of them.” - quote from respondent
Eighteen respondents express interest in a wider range of activities, including inclusive sports such as walking groups, walking tennis, and accessible swimming, as well as music, learning opportunities, and activities for people living with dementia (such as music, art, and gardening).
Three respondents emphasise the value of varied, inclusive programming that avoids stereotypes about older adults. One respondent also notes that reductions in funding for activities like bowls have affected some older residents who value them.
Getting to activities
Two-thirds of respondents (64%) feel able to attend local activities, while one-third are unsure or disagree (Figure 16, Appendix 2).
Thirty respondents mention barriers such as disability, limited local activities, unsuitable timings, caring responsibilities, costs and access issues (see cross-cutting themes).
“Many events and activities take place in the city centre. If you live on the outer edges of the city, it can be difficult and take a long time to get to them. More local activities would be nice!” - quote from respondent
Knowing who to contact in an emergency
The majority of respondents (70%) report knowing who to contact in an emergency (Figure 17, Appendix 2).
Four respondents mention challenges accessing healthcare facilities such as GP surgeries, opticians and dentists, with barriers outlined in the cross‑cutting themes section.
Three respondents also note limited affordable day care for older adults and people living with dementia, and one notes a lack of awareness of, and appropriate medical services for, housebound residents.
Meeting enough people
Almost two-thirds (61%) agree they meet enough people in their daily lives (Figure 18, Appendix 2). However, one third are unsure or disagree, with 9 describing significant experiences of isolation and loneliness linked to reduced social contact.
“I hardly meet anyone these days.” - quote from respondent
Survey findings: Respect and social inclusion
Experiences of local businesses
Opinions are mixed on whether businesses welcome older people: 29% agree, 24% disagree, and 44% are unsure (Figure 19, Appendix 2). Twelve respondents note that while some businesses make an effort, others could improve, suggesting simple changes such as providing chairs and quiet queues in supermarkets.
““Some businesses are making an effort e.g. a seat to sit down and face to face - others not at all” - quote from respondent
Opportunities to take part in the community
Over half of respondents (56%) are unsure or disagree that older people have enough opportunities to participate in their community, while 42% feel opportunities are sufficient (Figure 5).
“There are many opportunities on offer if people want to be involved.” - quote from respondent
“I feel B&H portrays itself as quite a young city with a family focus. I'm not sure how older people could be represented more, but it would be good to see.” - quote from respondent
Figure 5: Respondents’ views on whether older people are given the opportunity to take part in their community
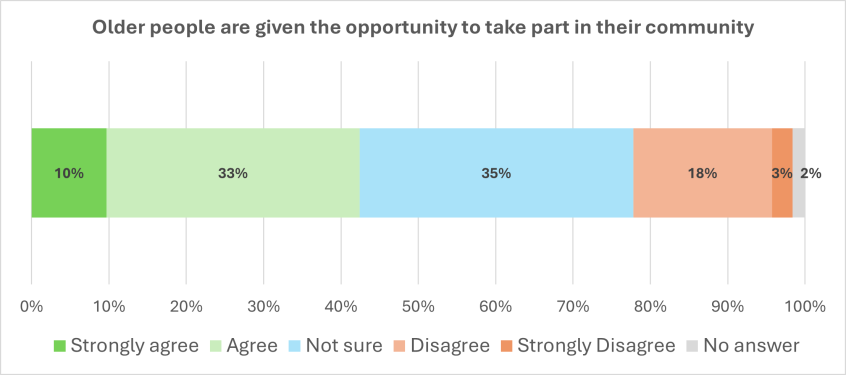
Older people are given the opportunity to take part in their community:
- strongly agree: 10%
- agree: 33%
- not sure: 35%
- disagree: 18%
- strongly disagree: 3%
- no answer: 2%
Twenty-seven respondents report not feeling fully included in the city. Seventeen feel that some council policies may prioritise younger residents and show limited understanding of older people’s needs, with 8 mentioning challenges such as citywide accessibility, digital exclusion and the effects of pedestrianisation and cycling infrastructure (see cross-cutting themes).
Three also note limited awareness of the needs of disabled, housebound and neurodiverse residents.
While 9 respondents describe experiencing kindness in the city, 21 mention encountering a lack of respect or ageist attitudes, with 6 feeling that this occurs more often among younger people (see cross-cutting themes).
“I find people kind and considerate” - quote from respondent
“It’s a young city which I like - but there needs to be more respect across the generations both ways.” - quote from respondent
Interactions between younger and older people
Opinions are mixed on whether younger and older people learn from each other in the city: nearly half are unsure (46%), while roughly a quarter agree (25%) and a quarter disagree (26%) (Figure 6).
Figure 6: Respondents’ views on whether younger and older people learn from each other well in Brighton & Hove
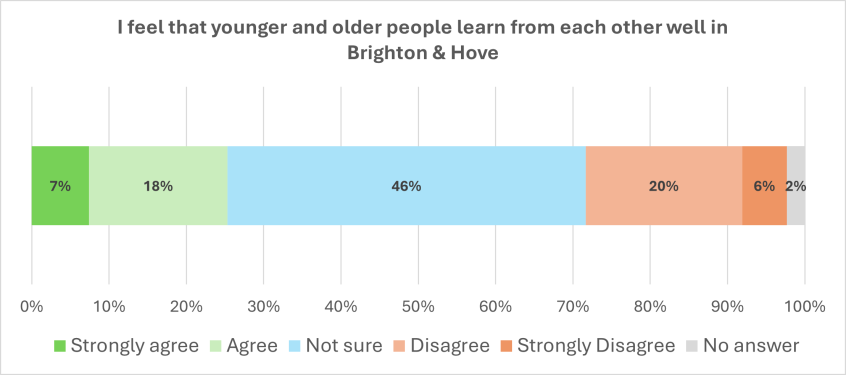
I feel that younger and older people learn from each other well in Brighton & Hove
- strongly agree: 7%
- agree: 18%
- not sure: 46%
- disagree: 20%
- strongly disagree: 6%
- no answer: 2%
“Brighton respects the differences, and I find age is just another difference. Good place to be old.” - quote from respondent
“I think there needs to be more done to make the various age groups mix together socially outside of families.” - quote from respondent
Four respondents praise existing intergenerational activities, such as dance groups at South East Dance, while another 4 feel there are limited opportunities. Three note the value of challenging stereotypes and promoting positive messages across age groups.
Ten respondents highlight the importance of creating more intergenerational opportunities, for example, through schools, youth groups, care homes and community centres.
Survey findings: Access to information
Access to the internet and using it to find information
Most respondents (78%) completed the survey online, while 22% used paper copies. Correspondingly, many participants (83%) report having internet access (Figure 20, Appendix 2) and using it to find information, though 27 still note limited digital skills or access and describe feeling excluded as more services move online (see cross-cutting themes).
Seventeen respondents highlight the need for alternative communication methods, such as printed materials, telephone support and in-person support (Table 13, Appendix 2). Six also say they rely on trusted sources, such as libraries, word of mouth, local Facebook groups, housing managers and HOP 50+, for up-to-date information.
Just over half of respondents (52%) are unsure or disagree that local event information is easy to find, while 45% agree (Figure 23, Appendix 2). Three feel information is accessible, 2 find it difficult to locate, and 7 report that although many activities take place across the city, information visibility is inconsistent - making some events easy to find and others easy to miss.
Three respondents also suggest creating an official events list, newsletter or calendar.
"Information about activities I think is generally good and accessible." - quote from respondent
“I hate that everything is online. Sometimes you just want to be able ring and speak to someone.” - quote from respondent
Accessibility and understanding of Brighton & Hove City Council information and eligibility criteria
Over half (53%) of respondents are unsure or disagree that council information is easy to understand (Figure 22, Appendix 2), and 59% are unsure or disagree that they know how to access eligible services and support (Figure 7).
Figure 7: Respondents' views on how to find out about eligible services and support

I know how to find out about what services and support I'm eligible for from Brighton & Hove City Council:
- strongly agree: 7%
- agree: 30%
- not sure: 31%
- disagree: 21%
- strongly disagree: 7%
- no answer: 4%
Eleven respondents note that council information is not always well communicated, can be difficult to find, and often feels fragmented, making it hard to navigate services and support. They suggest bringing all relevant information together in one place, with clear links and a coordinated “one‑stop shop” to improve signposting.
Two respondents also highlight the value of larger print in communications and surveys.
“What an incredible inclusive council that cares for all.” - quote from respondent
“Information about services should all be in one section, very disjointed at present.” - quote from respondent
Thirteen respondents report difficulties using the Brighton & Hove City Council website, particularly when navigating key services such as parking permits and Council Tax.
Four also mention a lack of alternative ways to access support, such as a mobile app or more direct routes to speak to someone, which can leave those who struggle online feeling excluded.
Perceptions of whether Brighton & Hove City Council values residents’ views
Almost 80% of respondents are unsure or disagree that the council values their opinion (Figure 8).
Four respondents mention concerns about trust and transparency in consultations, noting that online surveys, complex formats and limited feedback can make the process feel less accessible.
Figure 8: Respondents’ views on whether Brighton & Hove values their opinion
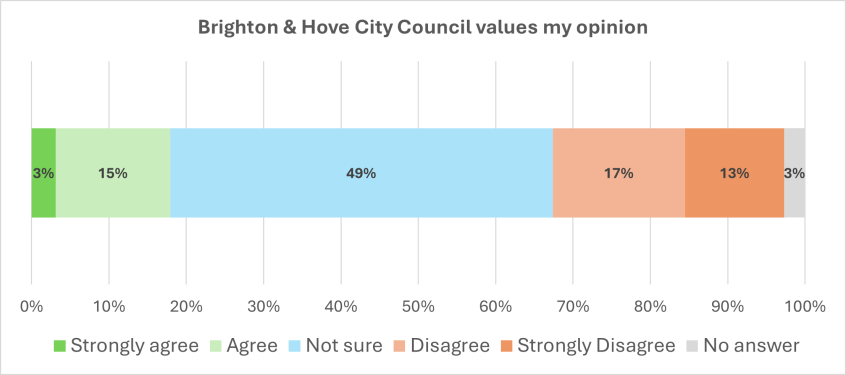
Brighton & Hove City Council values my opinion:
- strongly agree: 3%
- agree: 15%
- not sure: 49%
- disagree: 17%
- strongly disagree: 13%
- no answer: 3%
Since the survey closed, several improvements have already been made. Information on the Your Voice platform has been updated so surveys explain:
- how to request a paper copy
- how long they take to complete
- how to save progress on longer surveys
Internal guidance for officers has also been updated to support this approach.
Newsroom articles now clearly state how long engagement activities are open and include closing dates.
Feedback about the need for paper surveys at events has been shared with relevant services to improve future provision.
Survey design guidance now encourages officers to include space for additional or final comments, allowing people to raise issues not covered elsewhere. Work with the equalities team is underway to standardise equality questions across Your Voice surveys.
Where accessible formats are not available, a summary is provided within the project or survey to support understanding.
In addition, contacts from the Older People’s Council have been added to Brighton & Hove City Council’s stakeholder distribution lists, so they receive direct updates about new surveys and engagement opportunities.
Survey findings: Housing and community
Preference for staying in one’s own home
Almost 90% of respondents would like to remain living in their own home for as long as possible (Figure 24, Appendix 2). Two respondents feel that Senior Housing may not fully support independent living, while 3 express positive views, valuing the support, social opportunities and activities it provides.
“I live in supported housing, which for me is an excellent choice. I have support, activities and company if I choose.” - quote from respondent
Support to stay in my own home as I grow older
Almost three-quarters of respondents (74%) are not sure or disagree that they will receive the support they need to stay in their home as they grow older (Figure 25, Appendix 2).
Fourteen express anxieties about future care, particularly without family support, raising concerns about access, cost, quality and the lack of clear information. Three say they rely on family to live independently and feel uncertain about navigating care or accessing services on their own.
“I would need lots of support and signposting to different services to help me stay in my own home. I don't know how to do that at the moment.” - quote from respondent
One respondent suggests that Brighton & Hove City Council provide clearer, inclusive guidance for people with learning disabilities and neurodiverse people to support safe independent or shared living in the city.
Adaptability of homes to meet changing needs with age
Responses are evenly split on whether respondents’ homes can be easily adapted as residents grow older: 49% agree, while 48% are unsure or disagree about how to make adaptations or access grants for adaptations (Figure 26, Appendix 2).
Two respondents know how to find information on home adaptations, while 5 say they are unsure how to adapt their homes as they age.
“Don’t know anything about housing options or how I can make adaptions.” - quote from respondent
Finding information about different housing options
Almost three-quarters of respondents (73%) are unsure or disagree that they know where to find information about housing options (Figure 9).
Seven respondents report difficulty accessing clear information. One respondent also suggests encouraging residents to plan ahead and creating a role to help older people navigate housing and care systems.
Figure 9: Respondents’ views on whether they know where to find information about different housing options
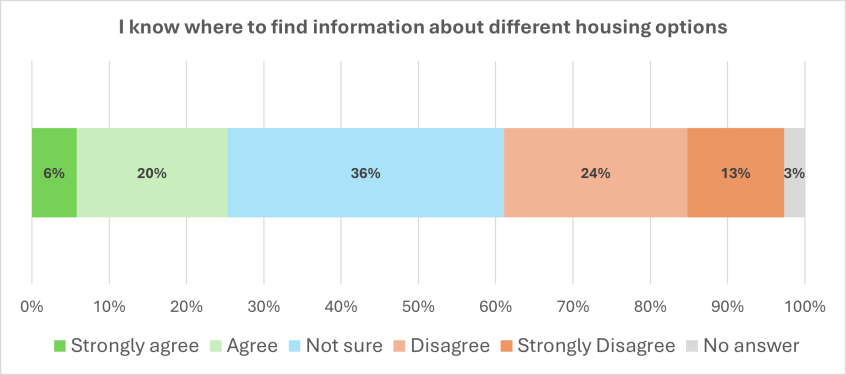
I know where to find information about different housing options:
- strongly agree: 6%
- agree: 20%
- not sure: 36%
- disagree: 24%
- strongly disagree: 13%
- no answer: 3%
Eight respondents note a shortage of housing that meets their needs as they age, including step-free options, while 7 report that it appears that flats and student accommodation are being built instead of accessible homes.
Three respondents also feel there's limited social and affordable seniors’ housing, and 2 highlight the lack of support for older renters facing high costs, both for those just above eligibility thresholds and those relying on housing benefits.
Six respondents express interest in more varied housing options for an ageing population, including:
- dementia friendly design
- facilities for older autistic people
- cohousing
- age-friendly communities with mixed housing types
- sites that combine independent living and care homes
Survey findings: Working and volunteering
Opportunities to be in paid employment
23% of respondents agree there are opportunities for paid employment in the city, while 34% are unsure and 34% disagree (Figure 27, Appendix 2).
Ten respondents note they are retired, and 11 describe challenges such as ageism, remaining in physically demanding jobs due to concerns about finding new work, difficulties securing employment after redundancy and low confidence with digital skills.
“Ageism is rife so employment for older people very difficult.” - quote from respondent
Volunteering opportunities
Over 60% of respondents feel that volunteering opportunities are available (Figure 28, Appendix 2). Thirteen know how to find information about volunteering, 3 currently volunteer in multiple roles, and 3 mention benefits such as meeting new people.
“I currently have 4 very different volunteer roles in Brighton and love them all. A great way to meet a wide variety of people and give help.” - quote from respondent
However, 32% are unsure or disagree that opportunities exist. Thirteen cite limited promotion and support, 10 mention complex processes, and 10 highlight financial, health or mobility barriers.
Five respondents suggest additional support, such as face-to-face advice and information events, to encourage participation.
“Volunteering needs to be better encouraged. So good for physical, social and mental health.” - quote from respondent
Conclusion and key recommendations
This survey, based on the 8 age and dementia friendly domains, provides valuable insight into the experiences of older people and people living with dementia in Brighton & Hove.
The findings will guide the next steps of the Age and Dementia Friendly programme and support the aim of creating a city where people can age well and continue doing the things they enjoy.
Cross-cutting themes
Analysis identified 3 cross‑cutting themes across all domains:
- Digital exclusion and difficulty finding information.
- Barriers to accessing public spaces, buildings and activities.
- The need for greater public and professional awareness of ageing and accessibility.
Priority needs
Within these themes, 10 priority needs emerged:
- Widely publicised, reliable, accessible information about activities, events and services.
- Improved citywide accessibility to support equitable access to public buildings.
- A diverse range of accessible and affordable activities.
- Accessible information on support to stay at home and housing options.
- Support for passengers to board and alight public transport safely and easily.
- Intergenerational programmes/spaces to support mutual respect across generations.
- Accessible toilets that are available for public use.
- Improved bus links to certain parts of the city.
- Increased opportunities for older people to take part in their community.
- Enough outdoor seating as resting places in public spaces.
How we'll use this report
These priorities, along with others highlighted in the report, such as supporting businesses to be age and dementia friendly, promoting volunteering, and accessible design, will shape the updated Age and Dementia Friendly Action Plan.
The Action Plan will guide the steps that the Age and Dementia Friendly Alliance, council departments and local organisations take over the next 3 years. Some of these actions are underway, and the partners involved in implementing them have already been making a difference in our older people’s lives. Other actions are still in the planning stage.
The Action Plan will remain a live document, evolving with ongoing feedback, and the survey findings will be shared with relevant partners. Further engagement will focus on communities underrepresented in the survey.
With an ageing population, Brighton & Hove City Council will continue working with stakeholders across all age and dementia friendly domains to improve the lives of older people and people living with dementia, benefiting the wider community as a whole.
Appendix 1: Respondents' demographics
As demographic questions were optional, percentages may not total 100%.
Table 1: Who the respondents normally live with
Who the respondents normally live with:
- on my own: 51%
- with someone who is not my carer: 27%
- other: 11%
- with someone who is my carer: 10%
- care home: 1%
Table 2: Respondents living with dementia or without dementia
Living with or without dementia:
- not living with dementia: 93%
- living with dementia: 7%
Table 3: Respondents' carer status
Respondents' carer status:
- not a carer: 82%
- carer: 12%
Table 4: Respondents' ages
Respondents ages:
- 20 to 24: 1%
- 35 to 39: 1%
- 40 to 44: 1%
- 45 to 49: 1%
- 50 to 54: 5%
- 55 to 59: 8%
- 60 to 64: 9%
- 65 to 69: 14%
- 70 to 74: 21%
- 75 to 79: 19%
- 80 to 84: 7%
- 85 to 89: 7%
- 90 and over: 3%
Table 5: Respondents' limited day-to-day activities
Respondent's day-to-day activities are limited due to a health problem/disability which has lasted, or is expected to last, at least 12 months:
- no: 37%
- yes, a little: 30%
- yes, a lot: 27%
Table 6: Respondents' sex and gender
Respondent's sex and gender:
- female: 66%
- male: 25%
- other: 2%
- non-binary: 1%
Table 7: Respondents' identified gender is the same as the sex registered at birth
Respondent's identified gender is the same as their sex registered at birth:
- yes: 91%
- no: 1%
Table 8: Respondents' sexual orientation
Respondent's sexual orientation:
- heterosexual/'straight': 72%
- lesbian/gay woman: 4%
- gay man: 4%
- queer: 3%
- bisexual/bi: 2%
- asexual: 2%
- other, please describe: 1%
Table 9: Respondents' ethnic origin
Respondents' ethnic origin:
- White: English, Welsh, Scottish, Northern Irish, British: 81%
- White: other: 8%
- Mixed: asian and white: 2%
- other ethnic group, please describe: 2%
- White: Irish: 1%
- Mixed: any other mixed/multiple ethnic background: 1%
- other ethnic group: Arab: 1%
- Black/Black British: Caribbean: 1%
Table 10: Respondents' religion or belief
Respondents' religion or belief:
- no particular religion or belief: 35%
- Christian: 35%
- Atheist: 8%
- other religion or belief, please describe: 4%
- other philosophical belief: 3%
- Jewish: 3%
- Pagan: 2%
- Muslim: 1%
- Buddhist: 1%
- Agnostic: 1%
Appendix 2: Figures and graphs
Outdoor spaces and public buildings
Figure 10: Respondents' views on whether Brighton & Hove has the shops and services they need
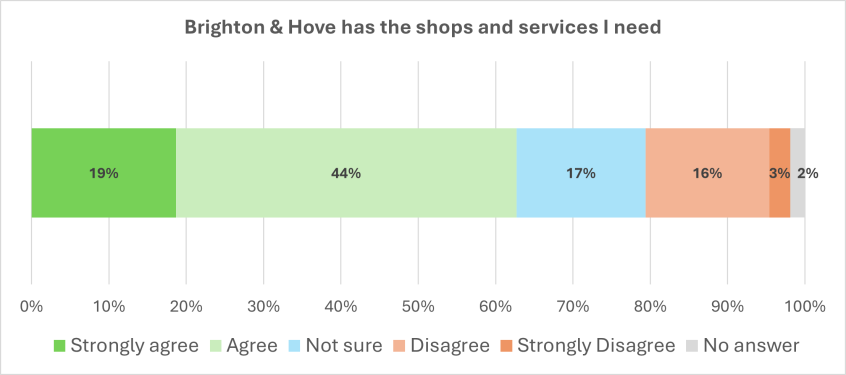
Brighton & Hove has the shops and services I need:
- strongly agree: 19%
- agree: 44%
- not sure: 17%
- disagree: 16%
- strongly disagree: 3%
- no answer: 2%
Table 11: Reported barriers to accessing public buildings, with frequency of mentions
Barriers to accessing public buildings and spaces.
Environmental factors - buildings:
- lack of wheelchair/mobility accessibility (9 mentions), such as ramps (4 mentions), functioning lifts (2 mentions)
- COVID concerns/ventilation (HEPA filters/windows) (2 mentions)
- lack of dementia awareness (2 mentions)
Environmental factors – spaces:
- uneven pavements (15 mentions) and roads (5 mentions)
- lack of clean and maintained public space (rubbish, graffiti) (11 mentions)
- difficulties and cost of parking/lack of disabled spaces at essential services (8 mentions)
- traffic, cars, bikes/e-bikes/e-scooters on shared paths (7 mentions)
- feeling unsafe, for example, drug and alcohol use and homelessness (5 mentions)
- pavements affected by clutter, crowds and construction (5 mentions)
- lack of public buildings in certain parts of the city (2 mentions)
Figure 11: Respondents’ views on whether they are happy with the number of public benches and rest areas in the city
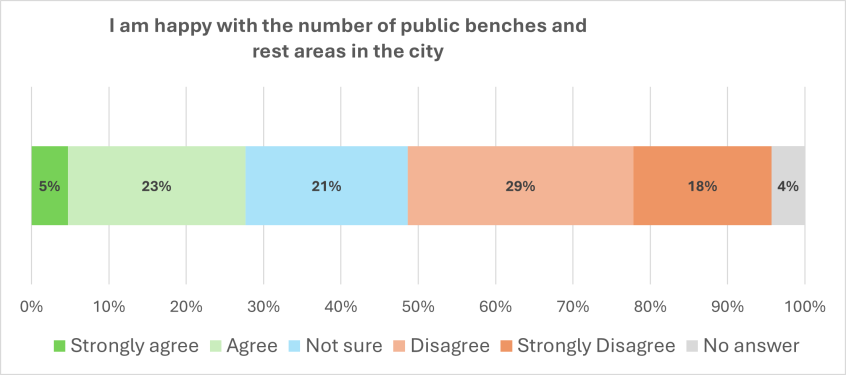
I am happy with the number of public benches and rest areas in the city:
- strongly agree: 5%
- agree: 23%
- not sure: 21%
- disagree: 29%
- strongly disagree: 18%
- no answer: 4%
Figure 12: Respondents’ views on whether there are parks and open spaces in the city that are easy to get to
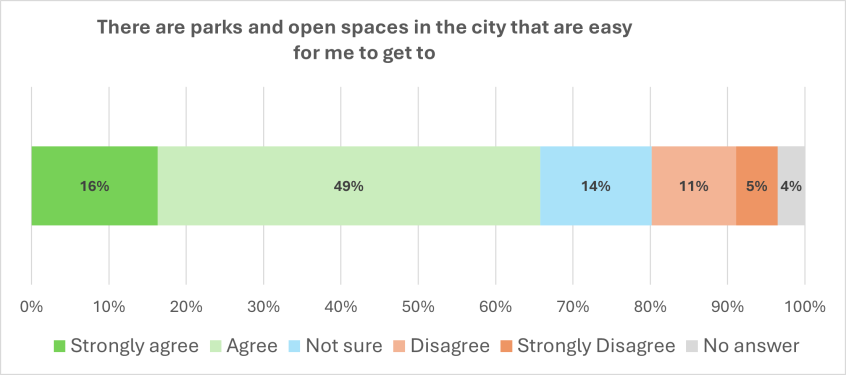
There are parks and open spaces in the city that are easy for me to get to:
- strongly agree: 16%
- agree: 49%
- not sure: 14%
- disagree: 11%
- strongly disagree: 5%
- no answer: 4%
Public transport
Figure 13: Respondents’ views on whether public transport gets them where they want to go
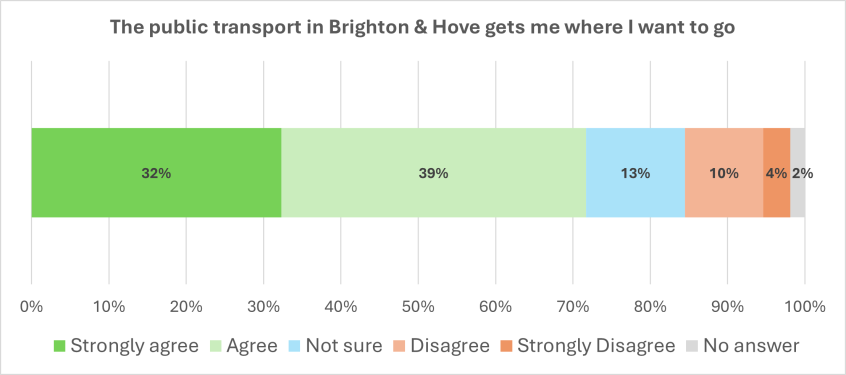
The public transport in Brighton & Hove gets me where I want to go:
- strongly agree: 32%
- agree: 39%
- not sure: 13%
- disagree: 10%
- strongly disagree: 4%
- no answer: 2%
Figure 14: Respondents’ views on whether public transport is convenient to where they live
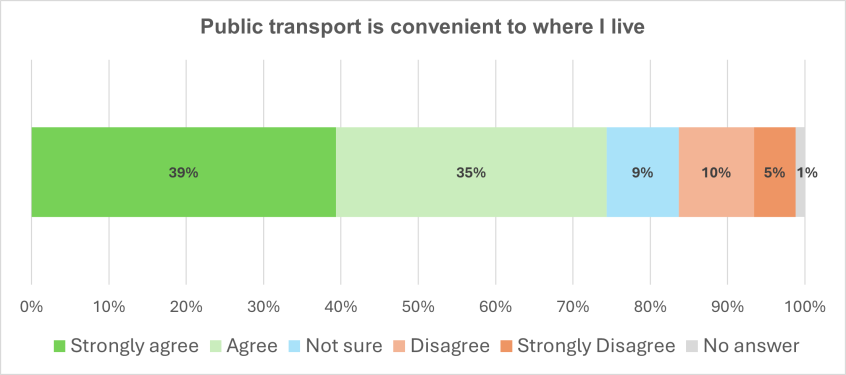
Public transport is convenient for where I live:
- strongly agree: 39%
- agree: 35%
- not sure: 9%
- disagree: 10%
- strongly disagree: 5%
- no answer: 1%
Table 12: Reported challenges in accessing public transport, with the frequency of mentions
Identified challenges using public transport:
- lack of accessibility awareness, signage, messages for staff/passengers (12 mentions)
- not being given enough time to get to the seat (9 mentions)
- concerns about the distance between certain bus stops (8 mentions)
- disability preventing use (6 mentions)
- travel costs (6 mentions)
- buses not pulling in close enough to the kerb (5 mentions)
- driver not always lowering the bus for easy access (5 mentions)
- overcrowding preventing essential trips, for example, to get to the hospital (5 mentions)
- bus pass restrictions (3 mentions)
- uncomfortable (2 mentions), cleanliness (2 mentions) and hygiene (2 mentions)
- kerbs that are too high (2 mentions)
- inaccessibility of bus stops on hills (1 mention)
- unsafe floating bus stops in cycle lanes (1 mention)
Figure 15: Respondents’ views on whether enough time is given when crossing the road at pedestrian crossings
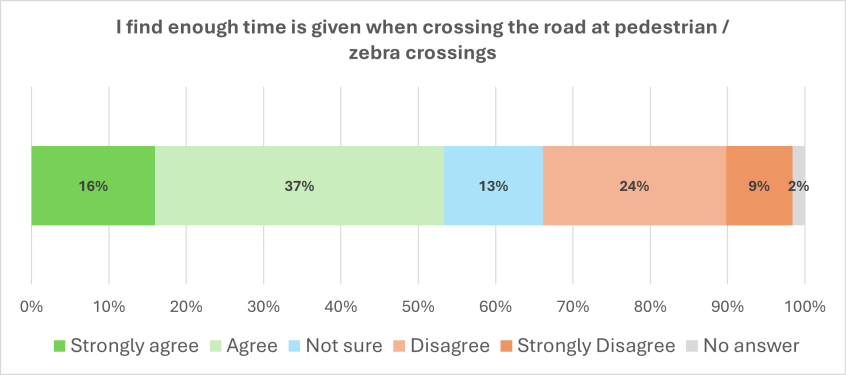
I find enough time is given when crossing the road at pedestrian/zebra crossings:
- strongly agree: 16%
- agree: 37%
- not sure: 13%
- disagree: 24%
- strongly disagree: 9%
- no answer: 2%
Health and social activities
Figure 16: Respondents’ views on whether they are able to attend local activities if they want to
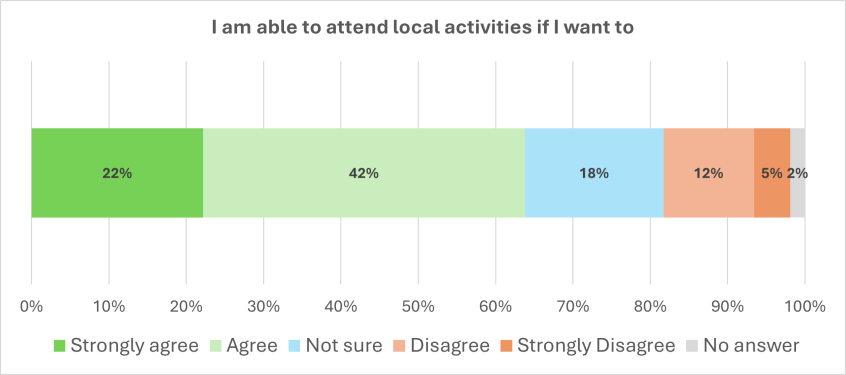
I am able to attend local activities if I want to:
- strongly agree: 22%
- agree: 42%
- not sure: 18%
- disagree: 12%
- strongly disagree: 5%
- no answer: 2%
Figure 17: Respondents’ views on whether they know who to contact in an emergency
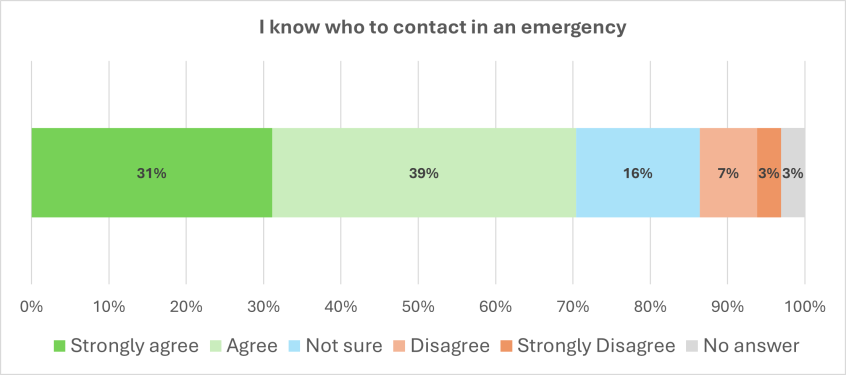
I know who to contact in an emergency:
- strongly agree: 31%
- agree: 39%
- not sure: 16%
- disagree: 7%
- strongly disagree: 3%
- no answer: 3%
Figure 18: Respondents’ views on whether they are meeting enough people in their daily lives
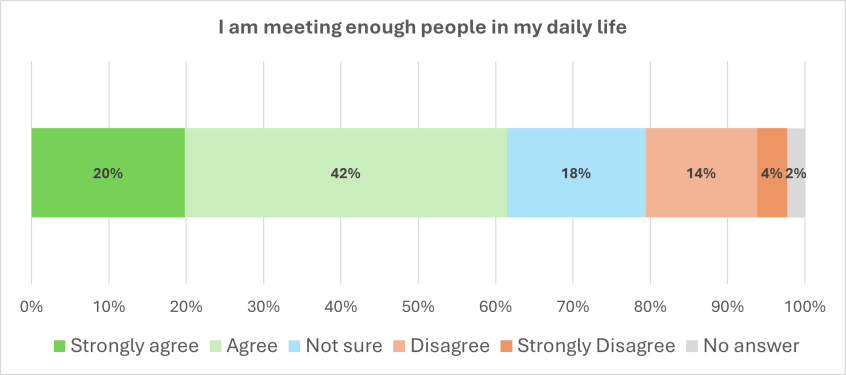
I am meeting enough people in my daily life:
- strongly agree: 20%
- agree: 42%
- not sure: 18%
- disagree: 14%
- strongly disagree: 4%
- no answer: 2%
Respect and social inclusion
Figure 19: Respondents’ views on whether they think businesses in Brighton & Hove make an effort to make older people feel welcome
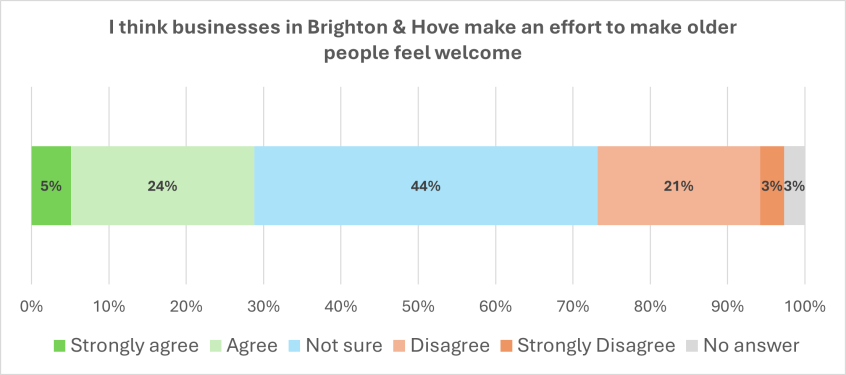
I think businesses in Brighton & Hove make an effort to make older people feel welcome:
- strongly agree: 5%
- agree: 24%
- not sure: 44%
- disagree: 21%
- strongly disagree: 3%
- no answer: 3%
Access to information
Figure 20: Respondents’ views on whether they have access to the internet and use it to find information
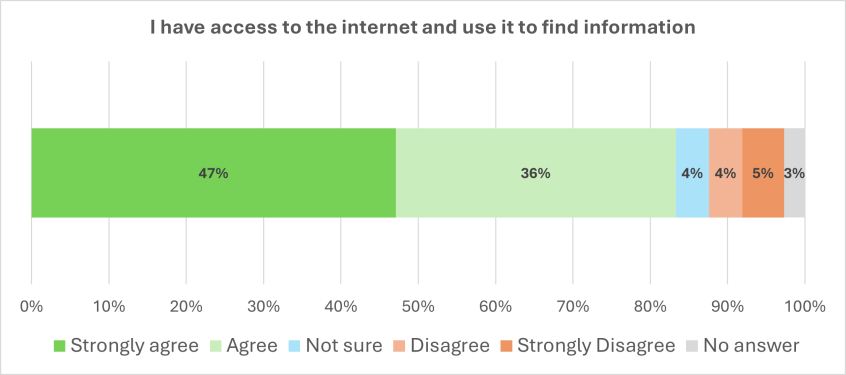
I have access to the internet and use it to find information:
- strongly agree: 47%
- agree: 36%
- not sure: 4%
- disagree: 4%
- strongly disagree: 5%
- no answer: 3%
Table 13: Suggested alternative communication methods to reduce digital exclusion, with frequency of mentions
Suggested alternative forms of communication:
- printed materials (6 mentions)
- accessible face-to-face contact, for example, at a support desk or tourist centre (6 mentions)
- telephone helplines (3 mentions)
- better promotion in public spaces, such as libraries, GP surgeries, and hospital screens (2 mentions)
- local media and radio (2 mentions)
- home-based digital support (1 mention)
- text messages (1 mention)
Figure 21: Respondents’ views on whether they would like support to start using the internet or to improve their internet skills
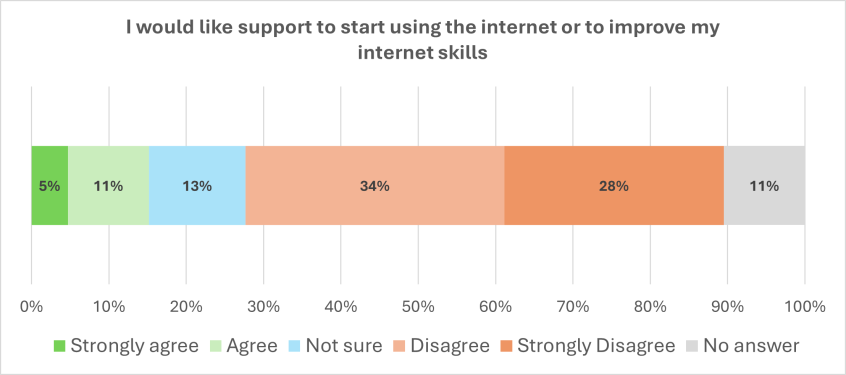
I would like support to start using the internet or to improve my internet skills:
- strongly agree: 5%
- agree: 11%
- not sure: 13%
- disagree: 34%
- strongly disagree: 28%
- no answer: 11%
Figure 22: Respondents’ views on whether the information that they get from Brighton & Hove City Council is easy to understand
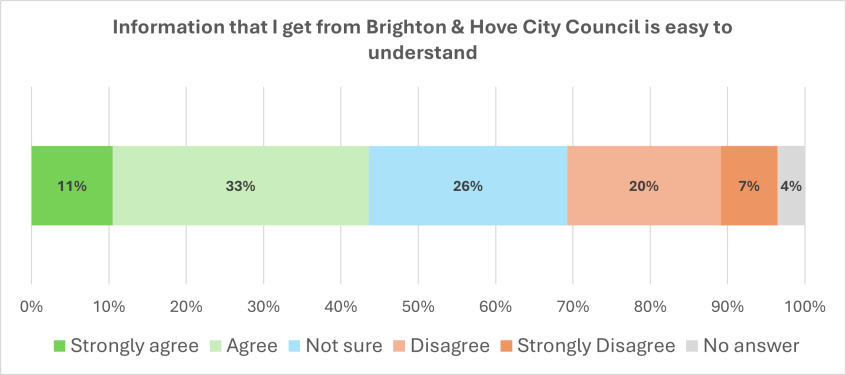
Information that I get from Brighton & Hove City Council is easy to understand:
- strongly agree: 11%
- agree: 33%
- not sure: 26%
- disagree: 20%
- strongly disagree: 7%
- no answer: 4%
Figure 23: Respondents’ views on whether it's easy to find out about local events that are happening in Brighton & Hove
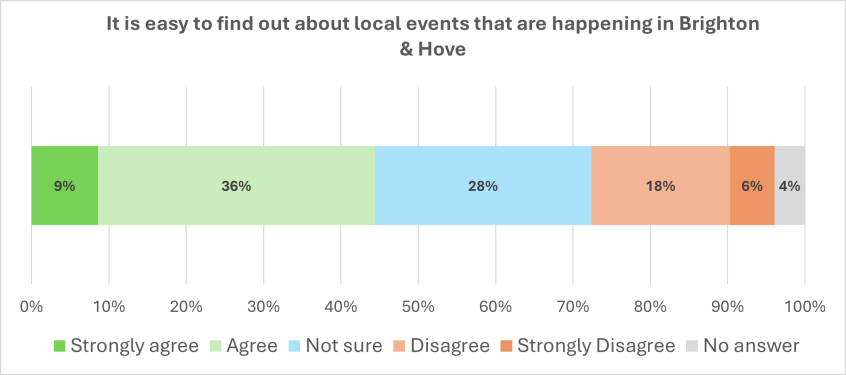
It's easy to find out about local events that are happening in Brighton & Hove:
- strongly agree: 9%
- agree: 36%
- not sure: 28%
- disagree: 18%
- strongly disagree: 6%
- no answer: 4%
Housing
Figure 24: Respondents’ views on whether they wish to remain living in their home in Brighton & Hove as long as possible
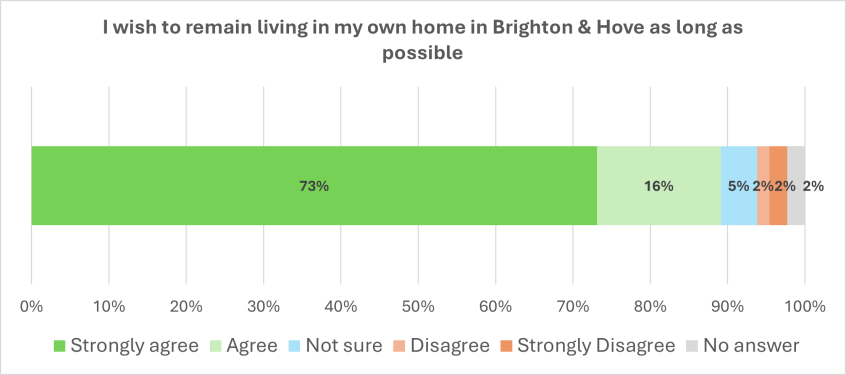
I wish to remain living in my own home in Brighton & Hove as long as possible:
- strongly agree: 73%
- agree: 16%
- not sure: 5%
- disagree: 2%
- strongly disagree: 2%
- no answer: 2%
Figure 25: Respondents’ views on whether they are confident that they will receive the support they need to stay in their own homes as they grow older
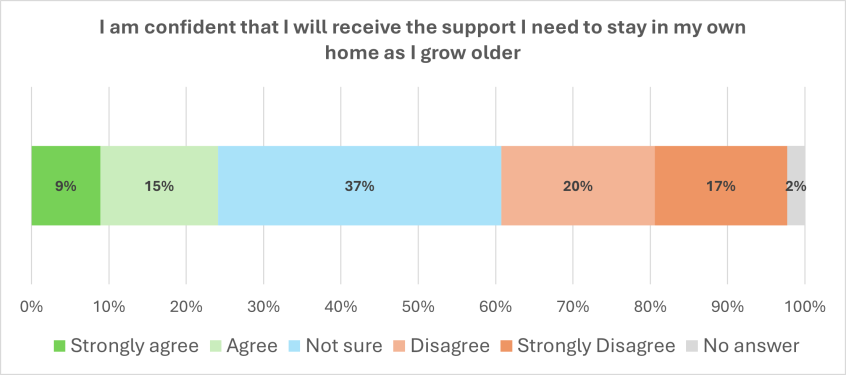
I am confident that I will receive the support I need to stay in my own home as I grow older:
- strongly agree: 9%
- agree: 15%
- not sure: 37%
- disagree: 20%
- strongly disagree: 17%
- no answer: 2%
Figure 26: Respondents’ views on whether their home could be easily adapted to their needs as they grow older
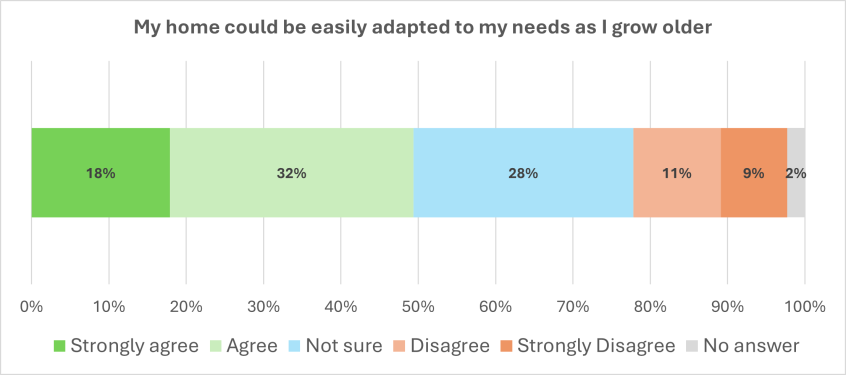
My home could be easily adapted to my needs as I grow older:
- strongly agree: 18%
- agree: 32%
- not sure: 28%
- disagree: 11%
- strongly disagree: 9%
- no answer: 2%
Work and volunteering
Figure 27: Respondents’ views on whether there are opportunities to be in paid employment
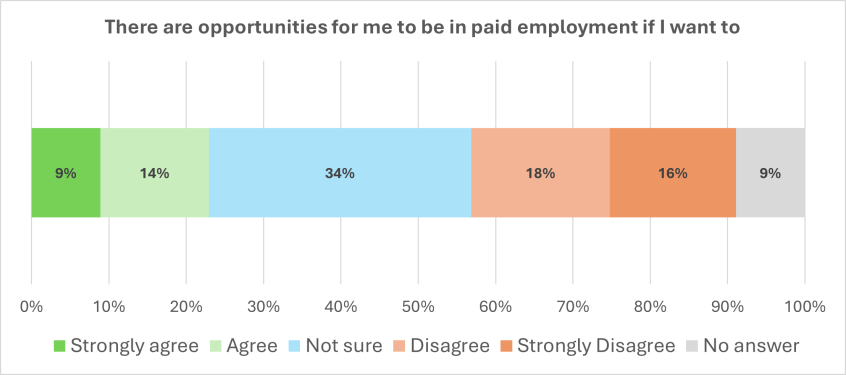
There are opportunities for me to be in paid employment if I want to:
- strongly agree: 9%
- agree: 14%
- not sure: 34%
- disagree: 18%
- strongly disagree: 16%
- no answer: 9%
Figure 28: Respondents’ views on whether there are opportunities to volunteer

There are opportunities for me to volunteer if I want to:
- strongly agree: 22%
- agree: 40%
- not sure: 22%
- disagree: 6%
- strongly disagree: 5%
- no answer: 6%