Brighton & Hove: Integrated Community Team (ICT) data profile
This profile focuses on key areas of focus for Integrated Community Teams. It is intended as a high level overview.
ICTs, and Brighton & Hove's ICT partnership areas are:
- a healthy place
- children and young people
- Mental health
- long term conditions, including cancer
- prevention (immunisation, screening and smoking cessation)
- patient needs group (from healthy to frail patients)
- multiple compound needs
- indicators highlighted in NHS Sussex ICB ICT data packs
This summary has been produced by the Brighton & Hove Public Health Intelligence and Research team. For more information, or feedback, send an email to: publichealthintelligence@brighton-hove.gov.uk
What ICTs are and how they are working to improve health and wellbeing and reduce inequalities in Brighton & Hove
The Sussex Integrated Care Strategy Improving Lives Together sets out the ambition across health and care in Sussex over the next five years. Its aim is to improve the lives of local people by supporting them to live healthier for longer and making sure they have access to the best possible services when they need them.
A key long term transformational aim of the strategy is to develop integrated community teams through local partnerships across Brighton & Hove, East Sussex and West Sussex – to allow services and organisations to work in a joined up way to better meet the needs of each local community.
The partners (NHS Sussex the three Local Authorities across Sussex and the Voluntary and Community Sector) have agreed the following vision for Integrated Community Teams:
“Joining-up (‘integrating’) health, social care, and health-related services across local communities in a way that best meets the needs of the local population, improves quality of services and reduces inequalities”
Brighton & Hove Health & Care Partnership have agreed a local Integrated Community Teams (ICTs) partnership approach for the city, with three geographical neighbourhood ICT partnerships across the West, Central and East of the city.
As a city we also have communities of interest/ identity that are best served through a city-wide integrated approach. A good example of this is our new Multiple Compound Needs Integrated Community Team that is providing healthcare and support to be people who are homeless that also experiencing compound health needs that leads to people experiencing multiple disadvantage and health inequalities.
The ICT data profile will support the work of our local ICTs as they come together as local partnerships to plan and deliver integrated health & care services to the local community. They provide narrative and maps to show inequalities within ICT partnership areas, as often indicators at ICT level mask important differences and inequalities within the area.
Brighton & Hove ICT partnership areas
Population by ICT
East Brighton & Hove
- Registered males: 57884
- Registered females: 51102
Central Brighton & Hove
- Registered males: 60499
- Registered females: 53212
West Brighton & Hove
- Registered males: 48282
- Registered females: 62298
Across the three ICT partnership areas, the GP registered population is fairly evenly split by sex. East and Central Brighton & Hove show a similar pattern with slightly more males than females. West Brighton & Hove has the largest registered patient population and more females than males.
GP registered vs estimated resident population
East Brighton & Hove
- Registered males: 111096
- Registered females: 99444
Central Brighton & Hove
- Registered males: 99384
- Registered females: 73628
West Brighton & Hove
- Registered males: 122797
- Registered females: 105298
In all ICT areas, GP registered list sizes are higher than the estimated resident population. The gap is smallest in East Brighton & Hove, with West Brighton & Hove showing a moderate difference. Central Brighton & Hove has the largest difference. These differences are consistent with known list inflation drivers in urban/university areas, including students remaining registered after moving, a more transient population and delays in de-registration, duplicate records and other administrative lags.
Registered lists exceed resident population due to list inflation (students, movers not de-registered, duplicates, delayed removals)
Brighton & Hove ICT partnership areas
The map below shows the three partnership areas in Brighton & Hove ICT, with LSOA level quintile of deprivation, the darkest shaded areas are in the 20% most deprived areas in England.
Deprivation
The proportion of residents in each ICT living in the 20% most deprived neighbourhoods nationally ranges from 5% in Central to 36% (more than one in three people) in East ICT partnership area
- West ICT: 7.0%
- Central ICT: 5.3%
- East ICT: 36.3%
Inequalities in Brighton & Hove
In parts of Brighton & Hove, people are dying years earlier than they should – for some people eight to nine years earlier. The gap in healthy life expectancy is wider at 12.5 years for women and 14 years for men.
In Brighton & Hove:
- A woman in the most deprived area will live 7.7 years less than a woman in the least deprived
- A man in the most deprived area will live around 9.1 years less than a man in the least deprived
A healthy place
Not having enough money and resources can cause poor health by making it hard to save, feel in control of our circumstances and keep healthy.
Money and resources
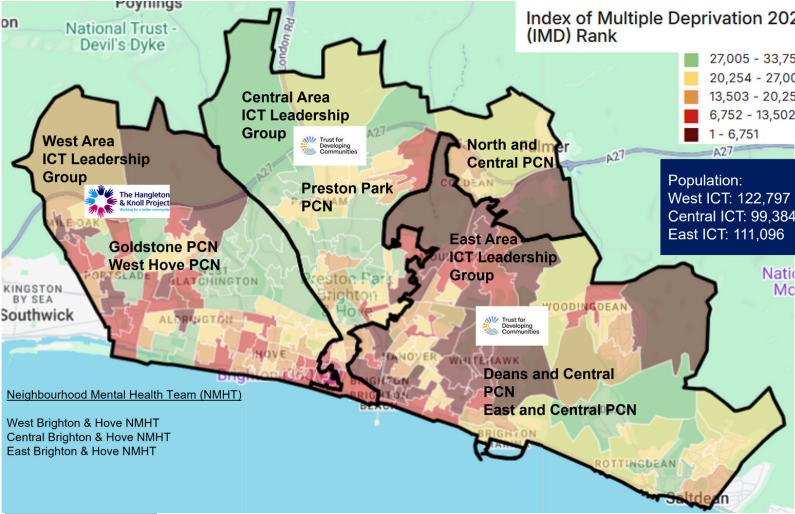
The city is one of the most deprived local authorities in the South East
- Highest concentrations in Whitehawk, Moulsecoomb, and Hollingdean in the East. But, along the coast, to the west of the city and in Woodingdean there are also pockets of deprivation
1 in every 6 children live in poverty in the city before housing costs
- In the highest area of the city it is 2 in 3 children. With the highest concentrations in the East of the city, but pockets in the West.
1 in every 5 people aged over 60 years are living in poverty in the city
- For England this is 1 in 7 people. This figure is 50% in some areas of the city, with pockets of older people in poverty across of the city.
Housing
We all need somewhere to call home – a secure, stable, warm, safe place to grow up and live in. Our homes influence our physical and mental health in many ways, and residents in the city face many housing pressures.
Housing is less affordable
- Those on the lowest 25% of earnings need 12 times their earnings to afford lowest 25% of house prices (2022) South East 10.4 times, England 7.3 times.
There is more privately rented housing and flats
- More than 1 in 3 households in the city, 1 in 5 across the South East & England. Half of households in the city live in a flat, South East and England (both 22%) - the highest % outside of London.
More homes in the city are estimated to be non decent and some areas of the city have high levels of estimates fuel poverty
- 17% of occupied homes are estimated to be non decent under the Decent Homes Standard. Across England it is 15%.
- 12% of households are estimated to be in fuel poverty: South East 8% compared to 13% across England. Estimates are higher in city centre areas close to the seafront and areas surrounding Lewes Road.
Education and unemployment
12% of adults in Brighton & Hove have no qualifications
- England 18% Areas in Hangleton, Mile Oak, Moulsecoomb, Whitehawk, Kemptown and Woodingdean are in the 20% of areas in England with the highest estimated rates
5% (7,700 people) are unemployed
- Higher than the South East (3%) and England (4%) (Year ending Sept 2023).
- There are pockets in the East, Central and West with unemployment in the top 20% of areas in England
Food
The Priority Places for Food Index shows areas where poverty, poor public transport and a lack of big supermarkets severely limit access to affordable fresh fruit and vegetables. Parts of Whitehawk, Moulsecoomb and Bevendean, Hollingdean, Hangleton and Woodingdean are in the top 20% of areas in England for the greatest food desert-like characteristics.
Air pollution
We know that air pollution impacts those who live in less affluent areas more greatly, widening health inequalities.
1 in 20 deaths in those aged 30 years or over in Brighton & Hove are estimated to be attributable to particulate air pollution (5%). Similar to England (5%) (2023.
Families, friends and communities
There are many assets within communities that can be used to promote health and wellbeing, including leisure centres and social activities, the community and voluntary sector, community groups, but also skills, knowledge and support.
Brighton & Hove has a strong community with higher rates of belonging, pulling together, formal volunteering and feeling that people from different backgrounds get on to England
- City Tracker survey results 2018
For the overall community needs rank, areas of Hangleton and Knoll, Mile Oak, Moulsecoomb, Whitehawk and Woodingdean are in the 20% of areas in England with the highest needs
Brighton & Hove has greater need, than England, for the civic assets and connectedness domains.
Digital exclusion
The extent to which people use the internet can impact on a number of life aspects such as social connections, access to services such as groceries, banking, employment, and access to health services.
Overall for Brighton & Hove, the digital exclusion risk index is lower than for England (2.6 compared to 3 respectively)
But there are areas of the city in the 20% of areas across England with the greatest risk of digital exclusion: in Whitehawk, Kemptown, Hollingdean, Mouslecoomb and Bevendean, and Hangleton
Social isolation and loneliness Social isolation and loneliness, especially when they are long-lasting, have negative impacts on our health. Social isolation is a term used to describe a lack of social contacts, community involvement, or access to services. Loneliness is an unwelcome feeling or lack or loss of companionship.
19% of adults feel lonely (always/often/some of the time). Similar to the South East (21%) and England (22%) (2019/20)
Over a third of older people live alone (38%, 13,900 people aged 66+) Much higher than the South East (30%) and England (31%) (2021
Children and young people
1.2% of children provide unpaid care (England 1.1%)
- There are areas across the city where this is over 3% of children and in the 20% of areas in England with the highest rates.
80% of five year olds are a healthy weight, this falls to 70% of children in aged 10-11 years
- This is better than England but there are an estimated 11,000 children and young people aged 2-15 who are above a healthy weight. Areas of Moulescoomb and Bevendean, Whitehawk and Coldean and Stanmer have some of the lowest levels of healthy weight.
There are higher A&E attendances for 0-4 year olds in areas of Whitehawk, Moulsecoomb and Bevendean, Central Brighton, Kemptown and Coldean and Stanmer
Childhood immunisation rates vary across the city
- Rates of childhood vaccinations are generally similar to the England average, although many are below target levels. Rates vary across the city and the overall ‘average’ figure is likely to be masking areas of low uptake.
Hospital admissions for self-harm in 10-14, 15-19 and 20-24 year olds are significantly higher in the city
- And we know from the city's Safe and Well at School Survey that there are significant issues around emotional wellbeing and mental health for young people in the city.
13,762 children living in poverty in the city AFTER housing costs
- That is over 1 in every 4 children (28%), lower than UK (31%), but higher than the South East (25%). A higher percentage of pupils in the city have SEN than England 24% (7,263) of pupils attending Brighton & Hove schools were recorded on school special educational needs (SEN) registers (either SEN Support or Education, Health & Care Plan (EHCP)) - above the England figure (18%) 6% have an EHCP (England 5%) and 18% are receiving SEN Support, which means they are on the SEN register, but do not have an EHCP (England 14%)
Mental health
Brighton & Hove has above average levels of mental health issues and higher rates of suicide deaths.
Brighton & Hove has the 10th highest rate of suicide and undetermined injury deaths in England, and the 2nd highest for females
It is estimated that 1 in 5 adults have a common mental health problem (around 46,000 adults)
- The national adults survey estimates that 1 in 6 people in England have a common mental health problem. However, the Office for Health Improvement & Disparities (OHID) estimate that the equivalent figure for the city is 1 in 5.
The prevalence of depression for Brighton & Hove is slightly higher than England.
- Those estimated to be suffering from depression in the city has continued to rise since 2012.
There is a higher rate of people out of work receiving support due to mental health related conditions
- There is a higher rate of claimants of Incapacity Benefit who are claiming due to mental health related conditions compared to East and West Sussex, South East or England. The highest rates are in Whitehawk and central Brighton.
Areas of Whitehawk, Mouslecoomb and Bevendean, Coldean and Stanmer, Kemptown, Central Brighton, and some areas in the West of the city have significantly higher levels of anxiety and lower levels of happiness
- Health Counts 2024 survey
One in ten adults have self harmed in the last year, 12% have ever made an attempt to take their life and 2% of all respondents have attempted to take their life in the last 12 month.
- This is higher in more deprived areas, including areas of Mouslecoomb and Bevendean, Coldean and Stanmer, Kemptown, and Central Brighton. Health Counts 2024 survey
Long-term conditions, including cancer
NHS Core20PLUS5 - Long Term Conditions cannot, at present, be cured, but people living with them can be supported to maintain a good quality of life.
Cancer
- Cancer accounts for the greatest number of deaths in the city
- Brighton & Hove has lower rates of cancer compared to England or our neighbouring areas of Sussex due to the younger population
- Ovingdean, Rottingdean and Woodingdean have the highest rates
- Screening rates for breast, cervical and bowel cancer are all lower than England and the overall mortality rate from cancer is significantly worse
Dementia
- Brighton & Hove has lower rates compared to England or Sussex
- Ovingdean, Rottingdean & Woodingdean have the highest recorded rates
- The city has a similar mortality rate of people with dementia to England
COPD
- Brighton & Hove has lower rates compared to England or Sussex
- Woodingdean, Whitehawk, Mile Oak & Portslade have higher rates
- Hospital admissions for COPD are lower than England
Asthma
- Brighton & Hove has lower rates compared to England or Sussex
- The rate for Brighton & Hove has risen slightly each year since 2020/21
- The highest rates are in Woodingdean, Whitehawk and Mile Oak
- Hospital admissions are similar to England
Diabetes
- Brighton & Hove has lower rates compared to England or Sussex
- Rates have increased steadily since 2012/13
- There are pockets of higher rates in Woodingdean, Whitehawk & Mile Oak
Hypertension
- Brighton & Hove has lower rates compared to England or Sussex
- Rates have increased steadily since 2021/22
- Mile Oak, Woodingdean, Ovingdean & Rottingdean have the highest rates
Atrial fibrillation
- Brighton & Hove has lower rates compared to England or Sussex
- The trend has remained static in recent years
- Woodingdean and Mile Oak have the highest recorded rates
Coronary Heart Disease
- Brighton & Hove has lower rates compared to England or Sussex
- The trend has remained static in recent years
- Ovingdean and Woodingdean have the highest recorded rates
Learning disability
- Brighton & Hove has similar recorded learning disability to England
- Both areas have risen in recent years
- The highest recorded rates are in Woodingdean and Whitehawk
Prevention (Immunisation, screening, smoking)
Immunisation
- Childhood immunisation rates vary considerably across the city, with some practices in the East Area ICT Partnership with particularly low rates, but there are practices in each area where rates are low
- West Area (79%) has the lowest shingles vaccine coverage of any Sussex ICT for those aged 80 years years (Sussex 84%). Central (81%) and East (82%) are also lower than Sussex.
- All Brighton & Hove ICT partnership areas have lower flu vaccination uptake than Sussex (57%) - East (47%), West (50%) and Central (52%).
Screening
- Brighton and Hove West Area ICT Partnership has the lowest breast screening coverage of any Sussex ICT (2023/24) at 65% compared to 73% for all Sussex ICTs. Central and East Area ICT partnerships are similar to Sussex (both 75%) but all areas have some practices with low rates.
- Brighton East Area (63%) and West Area (67%) have the lowest bowel cancer screening coverage of any Sussex ICTs (2023/24). Central (73%) is similar to Sussex (73%).
- Brighton East Area (58%), Central Area (60% and West Area (66%) have the lowest cervical cancer screening coverage of any Sussex ICTs (2023/24) in those aged 25-49 years (70% across Sussex).
- Brighton East Area (69%) has the lowest cervical cancer covered of any Sussex ICT for those aged 50-64 years (Sussex 75%)
Smoking
- East Area ICT Partnership has a significantly higher rate of current smokers (20%) than the city (17%), in Central it is 16% and West 15% (Health Counts 2024)
Patient Need Groups (PNGs) (from healthy to frail patients)
Brighton & Hove population grouped into high level patient need groups (PNGs), using the Sussex Integrated Dataset (SID), based on their overall health needs, from non-user to those with frailty or complex multi-morbidity. It shows that across the whole population, there are the following breakdown of health need:
- 2%: Frailty. Adults aged 65 and older with evidence of 2 or more frailty concepts (0.3% of all residents)
- 1%: High complexity, multi-morbidity.
- 8%: Dominant chronic. Dominant major chronic condition or dominant psychiatric/ behavioural condition
- 1%: Pregnancy. High complexity and low complexity.
- 27%: Moderate needs. Multi-morbidity, medium and low complexity.
- 63%: Healthy. Low need adult, child or non-user.
Patient Need Groups (from healthy to frail patients) by ICT partnership area
East ICT
- Frailty (all ages): 0.3%
- High complexity, multi-morbidity: 2%
- Dominant chronic: 9%
- Pregnancy (low and high complexity): 1%
- Moderate needs: 27%
- Healthy: 61%
Central ICT
- Frailty (all ages): 0.4%
- High complexity, multi-morbidity: 1%
- Dominant chronic: 7%
- Pregnancy (low and high complexity): 1%
- Moderate needs: 26%
- Healthy: 64%
West ICT
- Frailty (all ages): 0.3%
- High complexity, multi-morbidity: 1%
- Dominant chronic: 8%
- Pregnancy (low and high complexity): 1%
- Moderate needs: 27%
- Healthy: 63%
Moderate or high needs by age and sex
A snapshot of the number of residents in the moderate or high need patient groups by age and sex (percentages are the proportion of residents within each age-sex group who are classified as moderate or high need).
Brighton & Hove
| Age | Male | Female |
|---|---|---|
| 90+ | 651 (91%) | 1289 (96%) |
| 80 to 89 | 2936 (91%) | 4120 (92%) |
| 70 to 79 | 6159 (81%) | 6322 (80%) |
| 60 to 69 | 8402 (63%) | 7800 (67%) |
| 50 to 59 | 8524 (46%) | 8780 (54%) |
| 40 to 49 | 5919 (29%) | 6984 (41%) |
| 30 to 39 | 5092 (20%) | 6008 (28%) |
| 20 to 29 | 4658 (19%) | 7340 (26%) |
| 10 to 19 | 1538 (11%) | 1866 (14%) |
| 0 to 9 | 1658 (17%) | 1461 (15%) |
West ICT
| Age | Male | Female |
|---|---|---|
| 90+ | 279 (90%) | 616 (94%) |
| 80 to 89 | 1219 (89%) | 1804 (91%) |
| 70 to 79 | 2391 (79%) | 2553 (77%) |
| 60 to 69 | 3292 (61%) | 3100 (64%) |
| 50 to 59 | 3344 (43%) | 3421 (50%) |
| 40 to 49 | 2302 (28%) | 2902 (38%) |
| 30 to 39 | 1902 (21%) | 2398 (27%) |
| 20 to 29 | 1351 (20%) | 1949 (27%) |
| 10 to 19 | 501 (9%) | 609 (12%) |
| 0 to 9 | 620 (15%) | 544 (14%) |
Central ICT
| Age | Male | Female |
|---|---|---|
| 90+ | 148 (91%) | 302 (97%) |
| 80 to 89 | 674 (91%) | 947 (92%) |
| 70 to 79 | 1523 (82%) | 1561 (80%) |
| 60 to 69 | 2020 (62%) | 1938 (66%) |
| 50 to 59 | 2148 (45%) | 2373 (55%) |
| 40 to 49 | 1477 (28%) | 1783 (41%) |
| 30 to 39 | 1248 (17%) | 1494 (29%) |
| 20 to 29 | 1387 (17%) | 2150 (25%) |
| 10 to 19 | 504 (14%) | 605 (16%) |
| 0 to 9 | 407 (17%) | 357 (15%) |
East ICT
| Age | Male | Female |
|---|---|---|
| 90+ | 224 (92%) | 371 (96%) |
| 80 to 89 | 1043 (93%) | 1369 (92%) |
| 70 to 79 | 2245 (82%) | 2208 (82%) |
| 60 to 69 | 3090 (66%) | 2762 (71%) |
| 50 to 59 | 3032 (50%) | 2986 (59%) |
| 40 to 49 | 2140 (32%) | 2299 (44%) |
| 30 to 39 | 1942 (22%) | 2116 (29%) |
| 20 to 29 | 1920 (19%) | 3241 (27%) |
| 10 to 19 | 533 (12%) | 652 (14%) |
| 0 to 9 | 631 (19%) | 560 (18%) |
Multiple compound needs (MCN)
A quarterly snapshot of homelessness within Temporary Accommodation and Street Outreach Services in the City. Multiple Needs Mapping – Q4 2024/25.
Demographics
- 37% of clients supported by homelessness services are experiencing MCN
- 67% are male; 54% are aged 35–54
- The cohort is predominantly White British and heterosexual
MCN with substance abuse issues
- 77% with MCN are experiencing substance use issues
- 84% of this cohort have mental health issues
- 56% are involved with the criminal justice system (current or historic)
- 46% are known to be engaging with substance use services; 31% to mental health services
MCN with mental health issues
- 87% with MCN are experiencing mental health issues
- 31% are known to be engaging with mental health services
- 74% of this cohort have substance use issues
- 49% are involved with the criminal justice system (current or historic); 35% to substance use services
- 44% have a physical health need
MCN with domestic violence and abuse
- 33% with MCN are experiencing DVA issues; 86% have mental health issues
- 29% of this cohort are involved with the criminal justice system (current or historic)
- 30% are known to be engaging with mental health services; 23% to substance use services
MCN with a history of offending
- 52% with MCN have criminal justice involvement
- 84% of this cohort have substance use issues and 81% have mental health issues
- 33% are known to be engaging with mental health services; 47% to substance use services
- 11% are rough sleeping
Performance across ICT partnership areas
West ICT
- Falls (65 & Over) are at 6.2 per 1,000 Population in West ICT, compared to 5.9 across all ICTs
- Average Length of Stay (Over 65) is at 14.6 in West ICT, compared to 11.8 Mean
- Delays (excluding 0) in medical discharge are at 11.9 in West ICT, compared to 10.2
- Babies who received at least 3 doses of a DTaP vaccine before the age of 8 months is at 91.2 in West ICT, compared to 91.6
- Children who received at least 1 dose of MMR vaccine between the ages of 1 and 1.5 yrs is at 88.5 in West ICT, compared to 90.6
- Children, aged 5, who received a reinforcing dose of DTaP/IPV and at least 2 doses of an MMR vaccine between the ages of 1 and 5 yrs is at 84.2 in West ICT, compared to 87.2
- Breast screening uptake (aged 50 to 70 years old) is at 65.3 in West ICT, compared to 73.3
- Bowel cancer screening uptake (aged 60 to 74 years old) is at 66.7 in West ICT, compared to 73.4
- Patients, aged 80, who received a shingles vaccine between the ages of 70 and 79 yrs is at 78.5 in West ICT, compared to 84.2
- Cholesterol: patients with QRISK >= 20% treated with lipid lowering therapy is at 58.8 in West ICT, compared to 59.0
- Hypertension treated to appropriate threshold is at 61.9 in West ICT, compared to 65.9
- Total Care Contacts are at 478.3 per 1,000 Reg Pop in West ICT, compared to 595.4
- Did Not Attend (DNAs) as a % of care contacts are at 0.8% in West ICT, compared to 0.8%
- Hypertension treated to appropriate threshold is at 61.9 in West ICT, compared to 66.0
- Appointments seen by GP are at 36.9% in West ICT, compared to 41.9%
- Appointments seen within 2 weeks are at 77.1% in West ICT, compared to 79.3%
- DNAs are at 3.5% in West ICT, compared to 3.2%
- Cervical screening: Aged 25 to 49 in West ICT is 65.9 compared to 69.7
- Cervical screening: Aged 50 to 64 in West ICT is 73.5 compared to 74.6
- Covid-19 overall vaccine uptake in West ICT is 50.0% compared to 57.0%
- Covid-19 care home resident vaccine uptake in West ICT is 63.1% compared to 67.5%
- Covid-19 immunosuppressed vaccine uptake in West ICT is 26.9% compared to 29.0%
- Flu vaccine uptake in West ICT is 49.7% compared to 56.7%
Central ICT
- Average Length of Stay (Over 65) is 15.3 days in Central ICT, compared to 11.8
- Mean Delays (excluding 0) in medical discharge is at 14.3 in Central ICT, compared to 10.2
- Babies who received at least 3 doses of a DTaP vaccine before the age of 8 months is at 91.2 in Central ICT, compared to 91.6
- Children who received at least 1 dose of MMR vaccine between the ages of 1 and 1.5 yrs is at 87.9 in Central ICT, compared to 90.6
- Children, aged 5, who received a reinforcing dose of DTaP/IPV and at least 2 doses of an MMR vaccine between the ages of 1 and 5 yrs is at 80.4 in Central ICT, compared to 87.2
- Bowel cancer screening uptake (aged 60 to 74 years old) is at 73.0 in Central ICT, compared to 73.4
- Patients, aged 80, who received a shingles vaccine between the ages of 70 and 79 yrs is at 81.2 in Central ICT, compared to 84.2
- Cholesterol: patients with QRISK >= 20% treated with lipid lowering therapy is at 55.5% in Central ICT, compared to 59.0%
- Hypertension treated to appropriate threshold is at 65.4% in Central ICT, compared to 66.0%
- Proportion of SMI (Severe Mental Illness) health checks is at 60.6% in Central ICT, compared to 62.2%
- Total care contacts (appointments and telephone consultations) are at 317.0 per 1,000 Reg Pop in Central ICT, compared to 595.4
- Appointments are at 1,063 per 1,000 Reg Pop in Central ICT, compared to 1595
- Did Not Attends (DNAs) are at 3.4% in Central ICT, compared to 3.2%
- Cervical screening (aged 25 to 49) is at 60.3 in Central ICT compared to 69.7
- Covid-19 overall vaccine uptake is 53.1% in Central ICT compared to 57.0%
- Covid-19 care home resident vaccine uptake is 58.8% in Central ICT compared to 67.5%
- Covid-19 immunosupressed vaccine uptake 28.9% in Central ICT compared to 29.0
- Flu vaccine uptake is 51.6% in Central ICT compared to 56.7%
East ICT
- Attendances that are Urgent Treatment Centre (UTC) or a Minor Injury Unit (MIU) are at 49.6 per 1,000 Reg Pop in East ICT, compared to 37.5 across all ICTs
- Patients who had 5 or more attendances in 12 months (frequent attenders) is at 9.8% in East ICT, compared to 8.9%
- Mean Delays (excluding 0) in medical discharge is at 14.3 in East ICT, compared to 10.2
- Emergency Admissions are at 25.2 per 1,000 Registered Population in East ICT, compared to 24.3
- Falls (65 & Over) is at 7.1 per 1,000 Population in East ICT, compared to 5.9
- Average Length of Stay (Over 65) is at 14.2 in East ICT, compared to 11.8
- People discharged after the day they are medically optimised for discharge is at 13.6% in East ICT, compared to 12.8%
- Mean Delays (excluding 0) is at 11.8 in East ICT, compared to 10.2
- Babies who received at least 3 doses of a DTaP vaccine before the age of 8 months is at 87.9 in East ICT, compared to 91.6
- Children who received at least 1 dose of MMR vaccine between the ages of 1 and 1.5 yrs is at 86.2 in East ICT, compared to 90.6
- SMI (Severe Mental Illness) health checks are at 55.9% in East ICT, compared to 62.2%
- Bowel cancer screening uptake (aged 60 to 74 years old) is at 63.2 in East ICT, compared to 73.4
- Patients, aged 80, who received a shingles vaccine between the ages of 70 and 79 yrs is at 81.8 in East ICT, compared to 84.2
- Did Not Attends (DNAs) are at 4.4% in East ICT, compared to 3.2%
- Proportion of SMI (Severe Mental Illness) health checks is at 55.9% in East ICT, compared to 62.2%
- Did Not Attend (DNAs) as % of care contacts is at 0.9% in East ICT, compared to 0.8%
- Care contacts where the attendance was cancelled by the provider are at 25.8% in East ICT, compared to 24.4%
- Appointments per 1,000 Reg Pop is at 1470.0 in East ICT, compared to 1594.9 DNAs of care contacts are at 4.4% in East ICT, compared to 3.2%
Maps
Maps You can explore more data on the Local Insight web tool.