Due to the hot weather, some council services may need to change, but the majority of our services are operating as normal. Read our news story for more information.
Foreword
The climate and nature crisis is existential. We now routinely see the severe impacts of human activity on our environment, both here and abroad, and we must act. Our Climate and Nature Action Plan is at the heart of building a better Brighton & Hove.
Our Climate and Nature Action Plan is at the heart of building a better Brighton & Hove. It brings together practical actions from across the council that work to protect communities and reduce emissions, create opportunities for new skills and jobs, make areas safer to live in, restore nature, improve the lives of residents and shape a sustainable future for the next generation.
Brighton & Hove has long been a forward-thinking city where residents and businesses care about nature, the environment and being sustainablesustainability. As a council we have a strong track record of climate leadership, working with communities and collaborating with a range of partners, and have developed a clear, data-driven roadmap to Net Zero.
In 2025 we were awarded A-rated city status for the third year running by the Carbon Disclosure Project, and the actions detailed in this plan put us among the top 30 councils for climate action according to Climate Emergency UK.
Initiatives include building climate-resilient infrastructure, low carbon transport and active travel networks, providing energy-efficient homes with lower bills, reducing waste and increasing recycling, growing a circular economy and restoring habitats.
We are proud to have the best EV charging coverage outside of London and a growing electric bus fleet operating on key routes.
89% of our council homes now have an Energy Performance Certificate (EPC) of C or above and 5 leisure centres reached the milestone of producing 1 million kilowatt hours of clean energy through their rooftop solar.
In 2025 the city also made huge strides on waste reduction, with recycling collections expanded to include new materials and the first weekly food waste collections.
As a leader in circular economy practices, Brighton & Hove was part of the government’s Pathfinder programme to develop the UK’s first national Circular Economy Strategy.
We began the biggest sea defences scheme in the Hove to Shoreham area and completed the largest sustainable drainage scheme to date in Wild Park.
Through partnership with the UK’s only urban biosphere reserve – The Living Coast UNESCO Biosphere – and management of more than 5,000 hectares through the City Downland Estate, we have created wildflower meadows, new coastal habitat and supported regenerative farming.
We now need to accelerate this work at scale and pace.
Our Climate and Nature Action Plan sets out 133 actions for energy, climate adaptation and nature restoration to be delivered in the short, medium and long-term.
It includes a pipeline of investible energy decarbonisation projects, responding to extreme weather through capacity-building in communities, using nature-based solutions to reduce flood risk and filter pollution, responding to the rising cost of food through emergency food initiatives and local food growing, and supporting business to take up circular practices. It outlines ambitious projects to improve biodiversity, from habitat banks and urban wildlife areas, to farming with nature and creating landscapes teeming with wildlife.
Whether you’re a resident, business owner, community group, or partner organisation, this plan shows where we’re heading, why it matters, and how you can be part of the journey.
Councillor Tim Rowkins, Deputy Leader of Brighton & Hove City Council and Cabinet Member for Net Zero & Environmental Services
1. Introduction
1.1 Restating our commitment
Brighton & Hove is committed to bold and urgent climate action. In 2018, Brighton & Hove City Council declared a climate and biodiversity emergency and began development of a Carbon Neutral programme, with actions covering emissions reduction, climate change adaptation and biodiversity loss.
Our ambition and programme of work place Brighton & Hove among the country’s climate leaders. As a member of UK100 and the global Race to Zero coalition, the city stands alongside other progressive local authorities working to accelerate climate action and drive change for a better future.
Our commitment to this action is also underpinned by your voice—through the Brighton & Hove climate assembly, and citywide climate conversations, residents made it clear that transformative, inclusive, and future-focussed action is not optional, but essential.
Action to address climate change and nature restoration is needed to fulfil our collective obligations. But we need to be clear: our Climate and Nature Action Plan will bring multiple, wide-ranging benefits to our city, our residents and the environment – aligning with all four strategic outcomes of our Council Plan 2023 to 2027. Climate and biodiversity action will also deliver:
- warmer and more comfortable homes
- cheaper and more stable energy bills
- cleaner air and water
- better public health and wellbeing
- a thriving local economy
- skills and jobs creation
- improved public spaces for people and wildlife to live and thrive
- better resilience to extreme weather like flooding and heat waves
- improved food security
- improved energy security
- reduced pressure on public services including the social care system and the NHS
- a city to be proud of, with a safe and sustainable future
Conversely, there are significant economic, environmental and public health costs to inaction. Action is needed now to reduce these mounting costs and address climate and biodiversity risks.
1.2 Time for a refresh
With this refreshed Climate and Nature Action Plan, published in 2026, we are renewing our commitment to climate and biodiversity action —building on the Carbon Neutral Programme launched in March 2021. Five years on, this is a critical moment to reflect on our progress, respond to our improved evidence base, refocus our priorities, and react to a changing climate. Whilst we have delivered significant climate action since declaring a climate and biodiversity emergency, there is still much more to do.
We are also refreshing our action plan at a time when the national and local policy landscape has shifted, and financial pressures—on central government, local authorities, and residents—have intensified, making it ever more important to prioritise and target our efforts effectively.
Since 2021, we have strengthened our evidence base, including through the:
- Brighton & Hove Decarbonisation Pathways Report, published in 2024
- Climate Risk and Vulnerability Assessment (CRVA), published in 2023,
- Brighton & Hove economic plan 2024 to 2027 Evidence base, and the Sussex and Brighton Local Nature Recovery Strategy - expected in early 2026 following public consultation in Autumn 2025
These studies recommend a clear course of action to meet our climate and nature restoration ambitions.
Lastly, we also recognise that climate action must continue beyond Net Zero, particularly in climate adaptation and nature recovery, to ensure we have a sustainable and fair city fit for future generations.
2. What we've achieved so far
Brighton & Hove City Council has consistently led the way in climate action, being one of the first UK authorities to declare a climate emergency in 2018. Our ongoing work has been recognised with an ‘A-rated’ city status by the CDP for the last 3 years.
Territorial emissions cover emissions that occur within the UK's borders and are used to track UK-wide progress towards international and domestic targets, such as net zero emissions by 2050. They exclude emissions from imported goods and international aviation/shipping.
Since 2018, the baseline year for our Carbon Neutral Programme, our city-wide territorial emissions have fallen by 23%, and since 2005 our total city-wide territorial emissions have more than halved according to government figures. This shows that with concerted, co-ordinated local and national action, we can make a significant difference to our greenhouse gas emissions and join the global effort to limit the severity of climate change.
2.1 Action to reduce greenhouse gas emissions
Together with our partners, we have already delivered significant action to reduce greenhouse gas emissions across the city.
Energy and buildings
- In council homes, 89% now meet EPC C or above and 99% of boilers are A-rated.
- Over 1,013 solar arrays installed on council housing, saving 2,517.9 tCOâ‚‚e and £250 per tenant on average.
- Installation of Air Source Heat Pumps (ASHP) and thermal batteries in council housing, including the first installation of a communal ASHP in 2025.
- 1 million kWh of renewable energy produced by 5 leisure centres with rooftop solar, saving 504 tC02e.
- 35 school sites now host solar PV systems, saving £24,900 annually and cutting 179 tCOâ‚‚e by 2030.
- Peter Gladwin Primary School is the first fully low-carbon heated school.
- £826,522 funding secured to retrofit 100 private sector homes for low-income residents by 2028.
- Brighton Energy Cooperative (BEC) and Brighton & Hove Energy Service Company (BHESCo) own and operate ~7MW of rooftop solar PV and >450kW of heat systems between them.
- Sussex Energy leadership in scaling up regional ambition and activity.
Education and training
- 92% of primary and 50% of secondary schools engaged in climate education.
- 15 schools participate in the School Streets programme, improving air quality and biodiversity.
- New school meals contract agreed to tackle food waste and lower emissions.
- Network of decarbonisation academies established in the wider Sussex region, with five ‘training centres of excellence’ (including one at Greater Brighton Metropolitan College) in the built environment and electric vehicle technology. Engineering departments in local universities contribute to cutting edge research on energy and manufacturing decarbonisation.
- Local universities drive circular economy innovation through curricula, innovation centres, and research initiatives.
Transport
- 29 electric buses to be introduced by Brighton & Hove Buses in 2026, and 63 electric council vehicles already on the road.
- 494 public EV chargers installed, making Brighton the best-connected UK city outside London, with 7,200 more chargers to be installed over the next 15 years, the UK’s largest on-street charging project to date.
- 2,849 Ultra Low Emission Vehicles registered in Brighton & Hove.
- DfT funded £37 million bus improvement plan, including improved fare offers, express routes, and more inclusive access.
- Introduction of a new summer Park & Ride scheme.
- Transformation of Conway Street Bus Depot alongside plans to add 29 electric buses to local services in 2026.
- Ongoing delivery of the Local Cycling & Walking Infrastructure Plan including key schemes such as A23 (Argyle Road to north of Preston Park), Marine Parade and Western Road.
- 150 residents’ cycle hangars installed across Brighton & Hove, providing secure storage for 900 cycles.
- Beryl Bikes provides 780 shared bikes, 60% are electric-assist.
- Delivery of Our City Transport Plan 2035 following public consultation.
Waste and Circular Economy
- Recycling collections expanded to include new materials from June 2025 and food waste from September 2025.
- Expanded the number of communal carton recycling bins and introduced new communal electrical waste bins with pink lids in the spring of 2024.
- Circular economy principles embedded in housing, procurement, construction and land management policy.
- Partnered in major EU-funded project to boost circular economy, funding local behaviour-change pilots and community initiatives in 2021–2023.
- Primary and secondary schools engaged in circular economy learning and action through the Our City Our World environmental education programme
- 38 restaurants have completed Brighton & Hove’s Sustainable Restaurant Guide’s Sustainability Checklist, developed in collaboration with researchers from the University of Brighton.
- Pathfinder authority for Circular Economy, contributing to England’s first Circular Economy Growth Plan.
Supporting community climate action
- £1.3 million lottery funding supports climate activities for 25,000+ residents.
- Partnered in major EU funded project to boost circular economy, funding local behaviour-change pilots and community initiatives in 2021–2023.
- Community composting diverted over 600 tonnes of waste food since 2021.
- Partnered with Brighton Borrowers project to expand its free-to-use library of things across the city.
- Brighton & Hove’s Surplus Food Network saved 1,982 tonnes of food in 2022, preventing 7,493 tonnes of emissions.
2.2 Climate resilience
Rising sea levels, more frequent heavy rainfall and heatwaves threaten our city, our homes and our health. We have been working hard to protect our communities, infrastructure and chalk aquifer (the main drinking source for over 1.2 million people) from these threats.
Coastal protection
- As Lead Local Authority, the council oversees the Shoreline Management Plan from Beachy Head to Selsey Bill.
- Phase 1 of the Flood and Coastal Erosion Risk Management Scheme completed in 2024; Phase 2 completed in 2025.
Protecting our Chalk Aquifer
- Commissioned a city-wide SuDS feasibility study to inform a strategic approach to manage runoff, reduce flooding, and enhance biodiversity.
- Wild Park Rainscape, completed in 2025 with funding from The Aquifer Project and ï¿¡1.7 million from National Highways, now treating up to 2 million litres of rainwater run-off.
- Rain gardens built in 4 primary schools (Moulsecoomb, Carden, Middle Street and Coldean) with support from The Aquifer Project.
Surface flooding, run-off and the chalk aquifer
- The Aquifer Project engaged communities and landowners through education, regenerative farming trials, and partnerships to promote sustainable water management across the region.
Urban cooling
- Planted 25,000+ trees across the city, including new woodland areas, ash tree regeneration, community-led tree planting in parks and gardens, and street trees.
- 2,900 m2 of additional green space, and a 1,300 m2 wildflower meadow created in Valley Gardens.
- Network of public drinking fountains installed across the city.
Water efficiency
- Since 2023, the council's estate has saved ~66k cubic metres of water – enough to fill 26 Olympic-sized swimming pools.
- Planning enforcement of stringent water efficiency standards, which national planning regulations will catch up to in 2027.
2.3 Biodiversity enhancement
Biodiversity is our planet’s life support system. Protecting and restoring nature underpins the health and wellbeing of people and wildlife in an era of climate change.
Nature is crucial for our communities in providing vital ecosystem services, and since 2021 we have continued to protect and enhance our environment:
- We completed our first report under the Strengthened Biodiversity Duty, requiring all public authorities in England to consider what they can do to conserve and enhance biodiversity. A report goes to Defra in March 2026 and then every 5 years.
- We hosted The Living Coast UNESCO Biosphere, bringing people and nature together.
- We delivered the Changing Chalk Partnership, including the creation of 25 wildflower verges, and wilding of Waterhall former golf course to restore fragile chalk grassland.
- We restored Stanmer Park & walled garden including the planting of over 500 native trees.
- 20 B-Banks are flourishing across the city, attracting over 700 different wildlife species.
- We created and adopted a long-term strategy (the City Downland Estate Plan) for our agricultural estate and portfolio.
- We supported farm tenants into new agri-environment schemes.
2.4 Strengthening the evidence base
The council has adopted an evidence-based approach to climate action, commissioning studies and assessments to guide our priorities and ensure that our resources are used as effectively as possible. These studies include:
Brighton & Hove Decarbonisation Pathways Report (2024)
The Brighton & Hove Decarbonisation Pathways Study models four scenarios for Brighton & Hove’s decarbonisation journey. As a climate leader, the council is working on the ‘Leading the Way’ pathway, which incorporates fuel poverty and deprivation data to ensure a just transition. It identifies over 110 priority projects across the city, including building retrofits to improve energy efficiency and reduce bills, heat decarbonization projects such as communal heat networks and heat pumps, and solar PV deployment in strategic sites. The plan also identifies funding opportunities such as the Social Housing Decarbonisation Fund and private investment.
Climate Risk and Vulnerability Assessment (2024)
The Climate Risk and Vulnerability Assessment (CRVA) identifies 31 key risks across environment, infrastructure, health and business, as a result of expected climate changes. It informs relevant strategies such as the Air Quality Action Plan, the Climate and Nature Action Plan (this document), and our shoreline management plans.
Local Nature Recovery Strategy (2026)
As a statutory requirement from the Environment Act 2021, Brighton & Hove City Council has co-authored the new East Sussex and Brighton & Hove Local Nature Recovery Strategy. It identifies 23 habitat priorities, and 107 measures. Expected in March 2026 following public consultation in Autumn 2025.
Green Infrastructure Study (2024)
Commissioned by Brighton & Hove City Council and prepared by LUC, the Green Infrastructure Study maps over 1,400 hectares of accessible open space, 900 hectares of tree canopy, and 2,000+ hectares of priority habitats. It identifies areas of greatest need and deficiency, such as Portslade, West Hove, and the city centre, and informs policy to embed green infrastructure in our urban development.
City Downland Estate Plan (2023)
The Brighton & Hove City Downland Estate Plan is a long-term strategy to protect and enhance over 5,200 hectares of publicly owned land within the South Downs National Park. Developed through extensive consultation with residents, farmers, and stakeholders, the plan sets out a vision for sustainable land management, regenerative farming, nature conservation, climate resilience and improved access to nature.
2.5 The council’s culture, capacity and processes
The council has aimed to champion climate awareness internally, with the two cabinet members leading on decarbonisation passing the carbon literacy standard as part of the Carbon Literacy Project. Having a high level of awareness of climate change and the climate-related risks facing the city, at all levels in the organisation, is imperative for the council’s transition to carbon neutrality. The council has strived to do so, with more than 130 senior managers attending carbon literacy training and over 1100 council officers completing the internal climate change e-learning module.
There is an emphasis on embedding climate action plan aims in the delivery of projects, ensuring that the environmental aspect of projects and planning applications are properly considered.
Climate considerations are also embedded in the council’s procurement processes, with the promotion of its Orbis Environmentally Sustainable Procurement Policy and mandatory environmental sustainability scoring in tenders over £1 million.
3. Measuring and reporting progress
We are committed to transparency in our climate action, ensuring that our residents, partners, and funders can clearly see how we are addressing the climate and biodiversity emergency. Each year, we monitor and report city-wide emissions reduction as one of the council’s corporate Key Performance Indicators. Detailed Carbon Footprint Reports from previous years are published on the council’s website. These annual reports track emissions from council operations, including buildings, transport, and procurement.
We also disclose our climate action and results to the Carbon Disclosure Project (CDP), aligning our reporting with global best practice. This approach not only strengthens accountability but also supports evidence-based decision-making and demonstrates robust governance and measurable progress. In 2025, we were proud to receive an A grade from CDP for the third year running, placing Brighton & Hove among the top cities worldwide for climate transparency and leadership.
3.1 City-wide emissions
3.1.1 City-wide emissions inventory
Our city-wide territorial greenhouse gas emissions are estimated and reported annually by the Department for Energy Security and Net Zero (DESNZ). On page 14 we present the city’s territorial emissions estimates from 2018 until the latest data available from 2023.
Table 1 breaks down the city’s territorial emissions by sector and scope.
Scope 1 emissions
Greenhouse gasses emitted within the city boundary during fossil fuel combustion in transport, heating, plant and machinery (also accounting for emissions from the production and processing of fuels)
Greenhouse gasses emitted within and outside the city boundary during the disposal and recycling of waste produced inside the city boundary
Greenhouse gasses emitted from agricultural activities taking place inside the city boundary, excluding electricity consumption (includes emissions from soils, livestock, and non-electrical equipment powered by fossil fuels)
Greenhouse gasses emitted (+) or sequestered (-) as a result of land use, land use change, and forestry (LULUCF)
Scope 2 emissions
Greenhouse gasses emitted within and outside the city boundary during the generation and supply of electricity consumed inside the city boundary
Scope 1 emissions for sectors labelled “Public Sector”, “Domestic”, and “Commercial” are released by fossil fuel technologies, such as gas boilers, used to:
- heat homes (Domestic)
- schools, hospitals and other public buildings (Public Sector)
- office buildings and other commercial properties (Commercial).
Scope 2 emissions from these sectors are released during the generation and supply of electricity consumed by these properties. The DESNZ local authority greenhouse gas emissions statistics do not include the city’s Scope 3 emissions (see Section 3.1.2 for further discussion).
| Sector | 2018 - Baseline year(ktCO2e) | 2021 - Carbon Neutral Programme published (ktCO2e) | 2023 - Latest available data (ktCO2e) |
|---|---|---|---|
| Industry | 23.536 | 20.194 | 19.582 |
| Commercial | 64.186 | 56.905 | 58.907 |
| Public Sector | 39.57 | 40.35 | 30.62 |
| Domestic | 264.29 | 258.93 | 210.05 |
| Transport | 323.02 | 259.93 | 255.65 |
| Agriculture | 9.81 | 7.76 | 7.76 |
| Land Use, Land-Use Change and Forestry | 1.11 | 1.21 | 1.43 |
| Waste | 22.32 | 12.56 | 13.05 |
| Total | 747.841 | 657.846 | 597.047 |
| Percentage reduction to baseline | 0% | -9.29% | -18.66% |
| Sector | 2018 - Baseline year(ktCO2e) | 2021 - Carbon Neutral Programme published (ktCO2e) | 2023 - Latest available data (ktCO2e) |
|---|---|---|---|
| Industry | 8.43 | 6.84 | 6.12 |
| Commercial | 91.52 | 66.50 | 56.70 |
| Public Sector | 19.14 | 18.01 | 14.15 |
| Domestic | 102.77 | 88.99 | 69.80 |
| Transport | - | - | - |
| Agriculture | 0.30 | 0.13 | 0.12 |
| Land Use, Land-Use Change and Forestry | - | - | - |
| Waste | - | - | - |
| Total | 222.161 | 180.469 | 146.884 |
| Percentage reduction to baseline | 0% | -4.65% | -8.99% |
Source: UK local authority and regional greenhouse gas emissions statistics - GOV.UK
Figures 1, 2 and 3 provide visual representations of the city’s declining emissions over time, by sector and scope.
Figure 1 - 
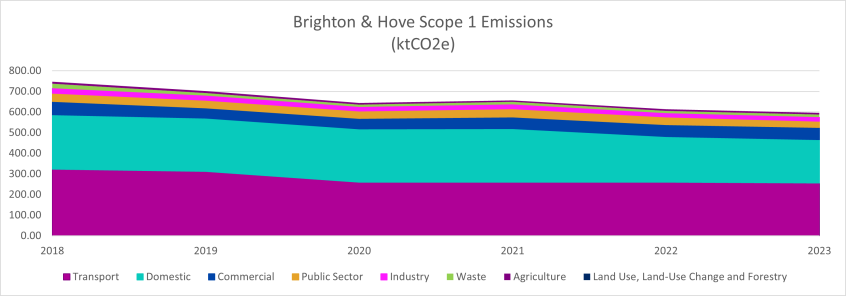
Brighton & Hove Citywide Scope 1 Emissions (ktCO2e) by Sector 2018 to 2023
Source: UK local authority and regional greenhouse gas emissions statistics - GOV.UK
Figure 2 - 
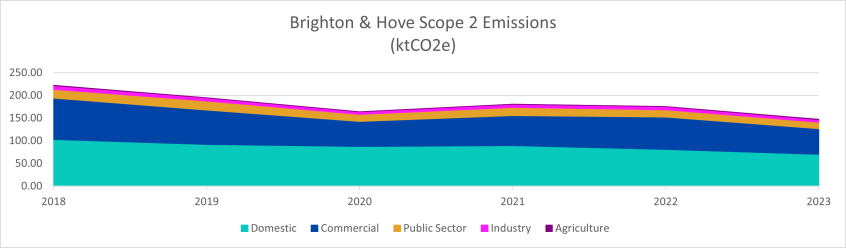
Brighton & Hove Citywide Scope 2 Emissions (ktCO2e) by Sector 2018 to 2023
Source: UK local authority and regional greenhouse gas emissions statistics - GOV.UK
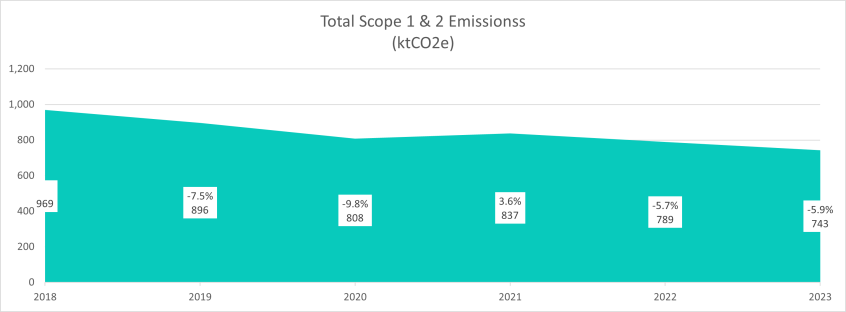
Figure 3 - Total Brighton & Hove Citywide Scope 1 & 2 Emissions (ktCO2e) 2018 to 2023
Source: UK local authority and regional greenhouse gas emissions statistics - GOV.UK
City-wide territorial greenhouse gas emissions dropped sharply in 2020 during the Covid-19 lockdown, then rose again as restrictions eased in 2021. Since 2021, the annual rate of reduction did not recover to pre-pandemic levels. This is largely due to the slowing of national grid decarbonisation, which drove the previous rate of decline. As the local rate of reduction has been mainly driven by these national factors, the same pattern can be observed across local authority areas across the UK. However, Brighton & Hove’s rate of reduction (5.8% in the two years following the launch of the council’s Carbon Neutral Programme) does slightly exceed the national local authority area average (5.2% over the same period), in part due to greater reductions in transportation-related greenhouse gas emissions.
Whilst territorial emissions are trending in the right direction, the 5.8% annual reduction has not kept pace with the science-based target to reach net zero by 2030, agreed in March 2021, which requires an average annual reduction of 12.7%, relative to the 2018 baseline year. The nationwide performance gap is thought to be due to a number of factors, including:
- the legacy of past infrastructure development - The UK’s transition to a national gas network in the 1960s and 1970s, rather than local heat networks as in many other European countries
- insufficient public investment in low carbon technologies - for example, lower levels of heat pump subsidy in the UK compared to European neighbours, prior to the Boiler Upgrade Scheme
- insufficient incentives for businesses and households to switch to low carbon energy - for example, high electricity:gas price ratio currently under review by Ofgem
3.1.2 Scope 3 emissions
The DESNZ local authority greenhouse gas emissions statistics do not include the city’s Scope 3 emissions, or greenhouse gases emitted during:
- The production and shipping of goods imported into the city
- The provision of services ‘imported’ into the city
- Road transport outside the city boundary, as part of an inward journey (for example, generated by work commutes and tourism)
- Resident transport outside the city boundary (for example, air travel)
Previous efforts to produce a partial estimate of the city’s Scope 3 emissions were enabled by the SCATTER cities tool, previously funded by Government. However, councils currently lack a reliable method to comprehensively estimate Scope 3 emissions, largely due to the lack of local-level consumption data.
The Place-Based Carbon Calculator estimates neighbourhood level carbon footprints, based on regional consumption averages by demographic groupings. More affluent residents tend to consume more goods, services, home heating, and international flights, resulting in higher carbon footprints. This is reflected at the neighbourhood level in the Place-Based Carbon Calculator map. The Place-Based Carbon Calculator estimates an average, city-wide carbon footprint of 7.8 tons per capita for Brighton and Hove, nearly 3 times the city’s per capita territorial emissions estimate reported in Section 3.1.1.
Because there is no consumption data to track changes over time (only estimates based on regional averages), we continue to monitor and report the city’s territorial (Scope 1 and 2) emissions estimates published by DESNZ. However, we know that action to mitigate all emissions remains vital to address climate change and deliver the benefits to our city. That is why many of the actions in our Climate and Nature Action Plan below aim to reduce emissions from across the city and beyond.
3.1.3 The challenge ahead
Despite the challenges, there are clear signs of momentum. National investment has driven record growth in net zero technologies—for example, heat pump installations rose by 56% in 2024. Yet uptake remains low overall, with only around 1% of UK homes using heat pumps, among the lowest in Europe. The UK Climate Change Committee (CCC) estimates that this must rise to 50% by 2040 to reach net zero by 2050.
In transport, the council is working at pace to rollout public electric vehicle (EV) chargers, but to reach net zero, over 39,000 private off-street electric vehicle chargers will need to be installed by households and businesses. Encouragingly, national policy is helping to improve the take-up. According to the CCC, the price gap between EVs and petrol cars narrowed from 37% in 2023 to 24% in 2024, and parity is expected between 2026 and 2028.
One major barrier remains—the high cost of electricity compared to gas, which slows the shift to electric heating. Yet over 80% of future emissions reductions must come from sectors such as transport, buildings, and industry shifting power to electric technologies. The pace of this progress will rely on improvement to the national ratio of electricity to gas prices – a major priority of central government.
National bodies such as GB Energy, Ofgem and the National Energy System Operator are working to address this, and Brighton & Hove City Council will engage closely to ensure local benefits.
Accelerating electrification is a key opportunity for Brighton & Hove to lead on—both in council operations and local policy. With national trends shifting, the city is well-placed to champion bold climate action and shape a cleaner, fairer future.
3.2 Brighton & Hove City Council’s corporate carbon footprint 2024 to 2025
Since the council’s Carbon Neutral Programme was published in 2021, we have acted at pace to reduce the greenhouse gas emissions from our council buildings and services. We have reported our carbon footprint annually, and present our latest report for 2024 to 2025 financial year below.
3.2.1 Our carbon footprint 2024 to 2025
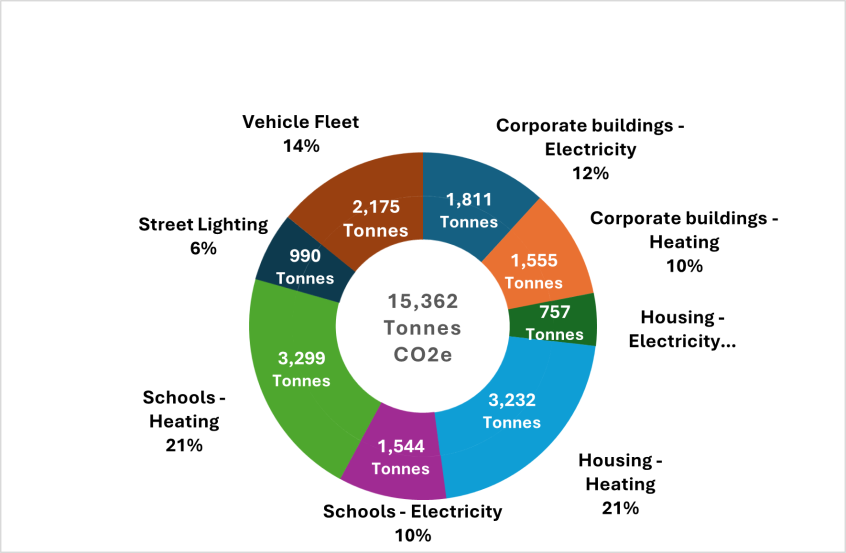
Brighton & Hove City Council’s total internal carbon emissions for 2024 to 2025 were 15,362 tonnes CO2e. These emissions have been calculated using consumption data taken from utility billing as well as actual meter readings where available.
Figure 4 - Total Brighton & Hove City Council Scope 1 & 2 Emissions (tCO2e) by Council Area 2024 to 2025
Scope 3 emissions—those that occur outside our direct operations, such as in our supply chain—are particularly challenging for local authorities to quantify. This is due to limited access to supplier data, inconsistent reporting practices, and the complexity of tracking indirect emissions across a wide range of activities. Therefore, at present, we are not able to report our Scope 3 emissions, as the data available to us is only partial and does not yet meet the standards required for accurate and meaningful disclosure. However, we are committed to improving transparency and are working towards reporting Scope 3 emissions in line with the global common reporting framework. As part of this journey, we are actively engaging with our contractors to encourage better data collection and reporting, and we are using our influence to help reduce emissions across our supply chain.
3.2.2 Comparison to baseline year 2009 to 2010
The council’s total annual emissions since the baseline reporting year of 2009 to 2010 have reduced by a total of 61%. This is equivalent to an average annual reduction of 4%.
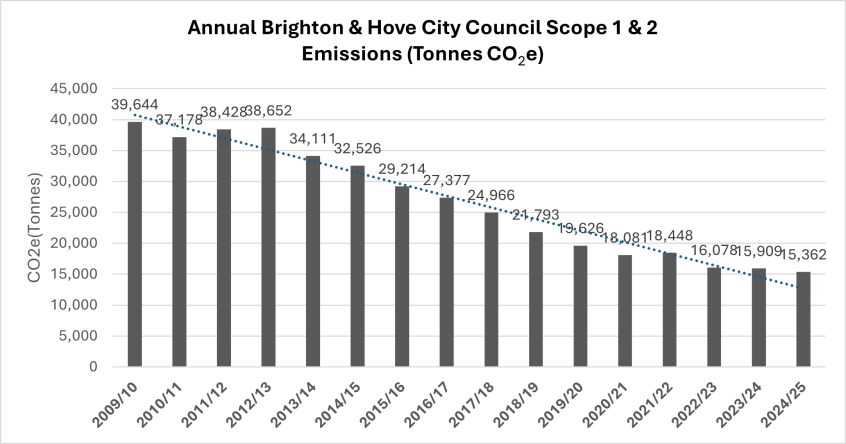
Figure 5 - Annual Brighton & Hove City Council Scope 1 & 2 Emissions (tCO2e) 2009/2010 to 2024/2025
Whilst we have achieved significant overall reduction of CO2e emissions since our baseline reporting year, there are variations in the reductions achieved between fuel types. These can be broken down as follows:
| Fuel Type | GHG emissions reported as tonnes of CO2 equivalent (tonnes CO2e) - Baseline Year 2009/10 | GHG emissions reported as tonnes of CO2 equivalent (tonnes CO2e) in 2024 to 2025 | % Change |
|---|---|---|---|
| Oil & Gas (Scope 1) | 13,855 | 8,086 | -42% |
| Diesel & Petrol (Scope 1) | 2,366 | 2,175 | -8% |
| Electricity (Scope 2) | 23,423 | 5,101 | -78% |
| Total emissions | 39,644 | 15,362 | -61% |
3.2.3 Our journey to Net Zero
In 2024 to 2025, the council saw an overall reduction of 3% in COâ‚‚e emissions from gas use, largely driven by efficiency gains in civic offices and vacated sites. However, we have seen a small increase in gas use in some housing schemes. Overall, emissions from gas and oil have dropped by around 42% since 2009 to 2010, showing a continued but slowing decline.
Fleet vehicle fuel emissions continued to drop in 2024 to 2025 by 2% thanks to reduced diesel and petrol use, largely driven by the ongoing electrification of the council’s vehicle fleet. Our electricity emissions overall fell by 5%, due to a decrease in electricity consumption across all council areas, and a decreased grid carbon intensity. Since 2009 to 2010, our electricity emissions have fallen by 78%, supported by national grid decarbonisation.
In 2024 to 2025, solar PV installations on council buildings generated an estimated 1,580,134 kWh of electricity, resulting in a carbon saving of 327 tonnes COâ‚‚e. Solar PV systems are installed across corporate buildings, schools, and communal housing areas. On-site solar generation reduces the amount of electricity buildings need to draw from the national grid. In our emissions reporting, this is reflected as a reduction in Scope 2 emissions, due to the lower consumption of grid-supplied electricity. Additionally, our programme of installing solar PV on our tenanted housing stock has generated 1,218,801 kWh of electricity in 2024/25, saving 150 tonnes COâ‚‚e, although this is outside the council’s emissions reporting scope.
Our continued journey to Net Zero is detailed below in Action Plan Part 1, focusing on moving away from fossil fuel energy for our heating and vehicles, and reducing our energy consumption through investing in energy efficiency. We remain committed to leading the way in fast and achievable decarbonisation of our council assets and operations, and we will continue to work in tandem with national and regional leaders working to decarbonise the grid and deliver energy infrastructure improvements.
3.3 Carbon sequestration or offsetting
It is worth noting that, in any scenario, our pathway to Net Zero will likely need to include an element of offsetting residual emissions. Residual emissions are emissions that are difficult or impossible to fully eliminate, for example emissions from landfill and wastewater treatment and the emissions embedded in our supply chain of essential goods and services. In our Decarbonisation Pathways Report, the “Leading the Way” scenario, or pathway with the most accelerated action by government, communities, industry and individual households, approximately 30,000 tCO2 remains to be offset in 2040.
To balance residual emissions and reach Net Zero, carbon would need to be sequestered or otherwise offset by active removals or other offsetting activity. Local opportunities for carbon sequestration are included in our Action Plan Part 3: Nature Restoration and include Nature Based Solutions. We may also seek to develop opportunities to market carbon and biodiversity credits for citywide investment. However, at present, our primary focus remains on reducing emissions.
4. Climate and Nature Action Plan: Introduction
This action plan is divided into three sections:
- Action Plan Part 1: Playing our part to reduce greenhouse gas emissions
- Action Plan Part 2: Climate change adaptation
- Action Plan Part 3: Nature restoration and enhancement
The actions and deliverables set out in this plan reflect a combination of external engagement, internal consultation on costed and pre‑approved programmes, and the findings of recent strategic studies.
Some commitments are shaped by opportunities to secure government funding, such as grants supporting the transition to electric bus fleets. Others arise from statutory responsibilities, including those set out in the Environment Act 2021 and the Flood and Water Management Act 2010. A further group of actions are the direct result of the council’s proactive investment in long-term climate planning, including work on the Climate Risk and Vulnerability Assessment (CRVA) and the Decarbonisation Pathways Study. These areas will require the development and costing of new projects and programmes, working closely with partners across the private sector, neighbouring authorities, and with local residents, businesses and communities.
Many actions also build on successful existing initiatives that support the wellbeing of residents and the natural environment, such as the city’s Surplus Food Network and the Local Cycling and Walking Infrastructure Plan.
Actions are divided into more detailed deliverables, each with their own indicator of relative impact, delivery timeframe, and key partners (those needed to support delivery).
While delivery timelines and certainty of funding vary across different actions, this action plan provides a clear statement of intent and direction for the years ahead.
5. Action Plan Part 1 - Playing our part to reduce greenhouse gas emissions
5.1 Energy
Transforming our energy systems is one of the most critical steps Brighton & Hove can take to tackle the climate crisis – one that requires the participation of local residents, businesses, communities, industry and anchor partners, such as the council.
Most of the city’s emissions come from how we heat our buildings, power our homes and businesses, and travel around. That’s why we plan to focus on accelerating the shift to low-carbon, electrified energy systems – the measures for which are outlined in the Brighton & Hove Decarbonisation Pathways Report. This evidence-based study highlights the scale and urgency of the challenge, and the need for co-ordinated action.
The most significant emissions reductions will come from actions that replace fossil fuels – particularly the electrification of heat and transport. These are essential for achieving deep decarbonisation across the city. However, enabling actions that reduce demand – such as LED lighting upgrades, improved building insulation, and battery storage – play a critical role in accelerating and supporting wider energy-system change. These changes help lower household and business energy bills and improve the business case for clean energy investments. They also help to minimise the need for costly and time-consuming electrical grid reinforcement, making it easier and faster to scale up electrification.
The council is taking the following actions to tackle greenhouse gas emissions from energy. Together, these actions form a balanced and strategic approach to decarbonisation – one that is both ambitious and achievable.
5.1.1 Retrofitting existing buildings and infrastructure
Timeframes: Short (2026 to 2028); Medium (2028 to 2030); Long (2030 onward)
| Deliverables | Impact on carbon emissions | Timeframe | Key Partners |
|---|---|---|---|
| Develop an investment plan to transition council assets to Net Zero, which considers cross-subsidisation between projects. | Enabling action | Short-term | The council (Net Zero Team, Finance, Housing, Estates, Place Making, Sports & Leisure); GSENZH; National Wealth Fund |
| Deliver a programme of renewable energy and energy efficiency retrofitting on council housing, aiming for all feasible council housing to achieve an EPC C rating as a minimum by 2030. | High | Short and medium-term | The council (Housing Sustainability & Energy Team) |
| Deliver a programme of renewable energy and energy efficiency retrofitting on the council’s corporate buildings including schools, sports & leisure facilities, community centres and municipal offices. | High | Short and medium-term | The council (Net Zero Team, Estates, Sports & Leisure) |
| Deliverables | Impact on carbon emissions | Timeframe | Key Partners |
|---|---|---|---|
| Replace remaining street lighting and traffic signals with LEDs through the completion of the street lighting modernisation and traffic signal replacement programmes. | Medium | Medium and long-term | The council (Transport Projects & Engineering, Traffic Control) |
| Deliverables | Impact on carbon emissions | Timeframe | Key Partners |
|---|---|---|---|
| Progress heat network feasibility based on highest potential opportunities identified in the Brighton & Hove Decarbonisation Pathways Report. | Enabling action | Short-term | The council (Net Zero Team); GSENZH; Heat Network Delivery Unit (DESNZ); Community energy; Heat network developers |
| Maximise local take-up of the Warm Homes Local Grant and future area based low-income grant schemes, as indicated in the national Warm Homes Plan, to lower emissions, tackle fuel poverty, and improve public health outcomes. | Low | Short-term | The council (Housing Sustainability & Energy team); Portsmouth City Council and other Warm Homes consortium members; Agility Eco |
| Enforce Minimum Energy Efficiency Standards (MEES) and incentivise improvements for example by offering a discount to HMO licence applicants with an EPC of A to C and assisting new private sector leasehold landlords to comply with MEES. | Low | Short, medium and long-term | The council (Private Sector Housing Team, Temporary and Supported Accommodation) |
| Promote and support locally the work of the national Warm Homes Agency, alongside local advice networks, so that residents are able to access comprehensive independent and reliable advice on energy efficiency, grants and funding streams, and upgrade and installation routes. | Enabling action | Short and medium-term | The council (Housing Sustainability & Energy Team; Net Zero Team); Brighton & Hove Energy Services Co-op (BHESCo); Citizens Advice; Energy Savings Trust, Sussex Energy |
Related Plans and Policies
- Brighton & Hove Decarbonisation Pathways Report
- Brighton & Hove Fuel Poverty & Affordable Warmth Plan 2024
- HRA Capital Investment Programme 2025.26 to 2029
5.1.2 Sustainable new buildings
Timeframes: Short (2026 to 2028); Medium (2028 to 2030); Long (2030 onward)
| Deliverables | Impact on carbon emissions | Timeframe | Key Partners |
|---|---|---|---|
| Deliver the New Build Housing Sustainability Policy for new council housing supply. | Medium | Short, medium and long-term | The council (Place making) |
| Explore establishing an internal monitoring system to better understand performance against project-specific sustainability targets and to support learning and innovation. | Enabling | Short-term | The council (Place making) |
| Deliverables | Impact on carbon emissions | Timeframe | Key Partners |
|---|---|---|---|
| As part of preparing the City Plan 2041, explore options for whole life carbon requirements of development proposals. | Medium | Short-term |
The council (Planning) |
Related Plans and Policies
- City Plan Part One
- City Plan Part Two
- New Build Housing Sustainability Policy
- Infrastructure delivery plan
5.1.3 Scaling energy decarbonisation through collaboration
Timeframes: Short (2026 to 2028); Medium (2028 to 2030); Long (2030 onward)
| Deliverables | Impact on carbon emissions | Timeframe | Key Partners |
|---|---|---|---|
| Develop a pipeline of investment-ready, net zero energy decarbonisation projects together with key partners, targeting priority projects identified in the Brighton & Hove Decarbonisation Pathways Report. | High | Short-term | The council (Net Zero Team, Finance); Large energy consumers such as University Hospitals Sussex NHS Foundation Trust, universities, and Shoreham Port; Community energy; Leaseholders of council properties such as schools and sports & leisure companies; Transport hub freeholders; UKPN |
| Utilise the council’s convening power to identify and progress multi-stakeholder decarbonisation opportunities in the city. | Enabling action | Short and medium-term | The council (Net Zero Team); Universities; University Hospitals Sussex NHS Foundation Trust; Care homes; Local schools; Museum Trust; Brighton & Hove Albion Football Club; Large fleet owners; Commercial landlords; Brighton Chamber of Commerce; Community energy; GB Energy |
Related Plans and Policies
- Public consultation on Sussex Mayoral County Combined Authority
- Brighton & Hove City Plan Part 2 (DM46 Heating and cooling network infrastructure)
- Brighton & Hove City Plan Part 1 (Section Three: Development and Special Area policies) and City Plan 2041 Key Issues Consultation
- Brighton & Hove Decarbonisation Pathways Report
5.2 Travel and Transport
Transport is the city’s second-largest source of carbon emissions, and the Brighton & Hove Decarbonisation Pathways Report identifies the electrification of vehicles - particularly cars, vans, and buses - as having the greatest potential for long-term carbon savings.
However, electrification alone is not enough. To reduce emissions effectively, we must also deliver a significant modal shift, especially in the period between now and near-universal vehicle electrification - encouraging more people to walk, wheel, cycle and use public transport. According to the Climate Change Committee, we will need to achieve a 7% reduction in car mileage by 2035 to meet national climate goals. The UK’s Transport Strategy aims for 55% of all urban journeys to be walked or cycled by 2035. This shift is especially important in cities like Brighton & Hove, where existing transport infrastructure make active travel more viable. Brighton & Hove has made great strides on this shift, with the highest bus-use per capita outside of London, and an ambitious Cycling and Walking Infrastructure Plan, but there is still more we can do. Encouraging modal shift also helps reduce the cost and speed up the transition, by lowering demand for electricity, minimising grid reinforcement needs and reducing reliance on critical minerals required for electric vehicle batteries. The council will continue to lead and enable this shift, but success depends on collaboration - from national policy to local investment and individual travel choices.
The council is taking the following actions to tackle greenhouse gas emissions from travel and transport.
5.2.1 Electrification of transport
Timeframes: Short (2026 to 2028); Medium (2028 to 2030); Long (2030 onward)
| Deliverables | Impact on carbon emissions | Timeframe | Key Partners |
|---|---|---|---|
| Council fleet to become fully electric through delivery of the Fleet Strategy. | Medium | Long-term | The council (Environmental Services) |
| Deliverables | Impact on carbon emissions | Timeframe | Key Partners |
|---|---|---|---|
| Expand on-street charging infrastructure by 1650 charge points by 2029 via delivery of an EV Charging Plan to meet growing demand, and create an inclusive public EV charging network that is convenient, affordable, and accessible. | High | Short and medium-term | The council (Parking EV Team) |
| Engage with commercial property owners and leaseholders to progress solar canopy and electric vehicle charging opportunities identified in the Brighton & Hove Decarbonisation Pathways Report. | Medium | Medium-term | The council (Net Zero Team, Parking EV Team) |
| Extend the licensing period for e-taxis before they need to be replaced and work with Charge Point Operators to maintain discounted charging for Brighton & Hove licensed taxis at rapid charge points to encourage the take up of e-taxis. | Medium | Short-term | The council (Parking EV and Taxi Licensing teams); taxi trade |
|
Deliver the government funded Zero Emission Bus Regional Areas (ZEBRA2) scheme to assist the electrification of Brighton & Hove Buses, to deliver 29 zero emissions buses by 2028 and improved charging capacity for further expansion of the electric fleet beyond 2028. |
Medium | Short and medium-term | The council (City Infrastructure, Air Quality and Net Zero Team); Brighton & Hove Buses; DfT |
| Deliverables | Impact on carbon emissions | Timeframe | Key Partners |
|---|---|---|---|
| Minimise energy demand and maximise on-site renewable energy generation through deliverables included in this action plan related to council building retrofit, the council’s sustainable new build developments, review of local planning policy, promotion of decarbonisation measures in existing private sector homes and commercial properties, and engagement with local stakeholders. | High / Enabling action | Short, medium and long-term | Sussex Energy and partners; MCCA; the council (Housing, Place Making, Net Zero Team and Planning); Development industry; Community energy; GB Energy |
| Where appropriate, develop business cases and seek approvals for development of medium-scale renewable energy generation projects. | Medium / Enabling action | Medium-term | The council (Net Zero Team); South Downs National Park Authority; Sussex Energy; GB Energy |
| Deliverables | Impact on carbon emissions | Timeframe | Key Partners |
|---|---|---|---|
| Work with neighbouring councils to provide a briefing note on the low carbon energy landscape in Sussex for reference by officers during the formation of the Mayoral Combined County Authority (MCCA). | Enabling | Short-term | The council (Net Zero Team and Cabinet Office); neighbouring Councils; Sussex Energy |
| Work in partnership with stakeholders across Sussex, through Sussex Energy and the MCCA (once formed) to attract funding and finance for energy decarbonisation across the region. | Enabling | Medium and long-term | Sussex Energy; the council (Net Zero Team and Cabinet Office); Mayoral Combined County Authority; neighbouring Councils; Community energy, Sussex Energy; GB Energy |
| Support future heat network zoning (Energy Act 2023) through stakeholder engagement and the Planning system. | High | Short, medium and long-term | Heat Network Zoning Authority (Mayoral Combined County Authority); DESNZ; GSENZH; the council (Net Zero Team, Planning, and Place making) |
| Together with partners on the Employer Representative Board, publish and deliver the Local Skills Improvement Plan for Sussex 2026-2029. The current Plan articulated the skills, capabilities and expertise needed for jobs in Sussex that directly contribute to or indirectly support Net Zero targets, adaptation to Climate Change or meet other environmental goals​. | Enabling action | Short and medium-term | The council (Employment and Skills); neighbouring Councils; Sussex Chamber of Commerce |
| Delivery of domestic retrofit assessor Skills Bootcamps to support upskilling. | Enabling action | Short-term | Further Education Colleges |
Related Plans and Policies
- Our City Transport Plan 2035
- Brighton & Hove Decarbonisation Pathways Report
- Electric Vehicle Charging Plan
- Zero Emission Bus Regional Areas (ZEBRA) 2 scheme
- Brighton & Hove City Council Fleet Strategy
- Air Quality Action Plan 2015
- Read our latest Annual Air Quality Status Report
5.2.2 Providing safe, inclusive, sustainable and healthy alternative travel options
Timeframes: Short (2026 – 2028); Medium (2028 – 2030); Long (2030 onward)
| Deliverables | Impact on carbon emissions | Timeframe | Key Partners |
|---|---|---|---|
| Strategic programme setting out the priorities for transport and travel in the city, to support a more inclusive and accessible city. The programme will deliver reduced GHG emissions, improved air quality and public health, safer streets, and a stronger more sustainable local economy. | High | Short, medium and long-term | The council (Transport Planning); transport operators; businesses; educational establishments |
| Deliverables | Impact on carbon emissions | Timeframe | Key Partners |
|---|---|---|---|
| Provide mobility hubs, that will improve access to public transport, car clubs and other shared transport. Strategic mobility hubs on the edge of the city will provide Park & Ride facilities for those visiting and commuting, while smaller neighbourhood mobility hubs will provide easy access to public transport, car or bike hire. | Low | Short, medium and long-term | The council (Transport Projects & Engineering, Public Transport) |
| Continue to expand bikeshare schemes to support car-free development, cycling infrastructure upgrades and Park & Ride. Explore introducing e-cargo bikes and e-scooters, subject to funding and approval. Improve servicing with a new central city operational base. | Low | Short, medium and long-term | The council (Transport Projects & Engineering); bikeshare operators |
| Work with the city's car club operators' fleet and charge point operators to further electrify the car club. | Low | Medium-term | The council (Parking) |
Related Plans and Policies
- Our City Transport Plan 2035
- Bus Service Implementation Plan
- Local Cycling and Walking Infrastructure Plan
- Brighton & Hove Physical Activity and Sport Strategy 2024 to 2034
- Air Quality Action Plan 2015
- Read our latest Annual Air Quality Status Report
- The Living Coast UNESCO Biosphere Sustainable Futures 2025 to 2034 report
5.2.3 Sustainable logistics
Timeframes: Short (2026 – 2028); Medium (2028 – 2030); Long (2030 onward)
| Deliverables | Impact on carbon emissions | Timeframe | Key Partners |
|---|---|---|---|
| Engage with the city’s commercial landowners and leaseholders to progress electric fleet charging hubs at sites identified in the Brighton & Hove Decarbonisation Pathways Report. | High | Short and medium-term | The council (Net Zero Team and Parking – EV Team); business park / commercial property owners; UK Power Networks; Department for Transport |
| Deliverables | Impact on carbon emissions | Timeframe | Key Partners |
|---|---|---|---|
| Support SMEs and traders to switch to e-cargo bikes to deliver goods and services to customers and clients within the city. | Low | Short-term | The council (Transport Projects & Engineering) |
| With neighbouring authorities, scope opportunities and seek funding for a micro-logistics hub within Mobility Hub planning. | Medium | Long-term | The council (Transport Projects & Engineering); Neighbouring authorities |
| Using the council's convening power, explore express (light) freight opportunities at Brighton station for sustainable last mile delivery. | Medium | Short-term | The council (Transport Planning, Public Transport, Net Zero Team); Network Rail; Great British Railways; courier services; supermarkets |
| Deliverables | Impact on carbon emissions | Timeframe | Key Partners |
|---|---|---|---|
| Develop an active and sustainable travel network through the ongoing delivery of priority routes and areas identified in the Local Cycling and Walking Infrastructure Plan (10-year programme of investment). New routes to be identified once the current A23 and Seafront A259 Active Travel Schemes are completed. | Medium | Short, medium and long-term | The council (Transport Planning) |
| Invest in the maintenance of and improvements to the city’s road and pavement network for active and sustainable travel. | Low | Short, medium and long-term | The council (Network Management) |
| Support high-quality public realm and measures to facilitate active travel in new developments through City Plan 2041. | Medium | Short-term | The council (Planning) |
| Expand School Streets citywide, start ANPR (automatic number plate recognition) enforcement in 2026, and upgrade infrastructure to improve streetscapes. Where closures aren’t possible, install streetscape improvements to benefit families. | Medium | Short, medium and long-term | The council (Transport Projects & Engineering, Transport Strategy, Parking, City Parks, Environment); local schools; Walk Wheel Cycle Trust (formerly ‘Sustrans’) |
| Deliverables | Impact on carbon emissions | Timeframe | Key Partners |
|---|---|---|---|
| Encourage mixed forms of travel with good transport interchanges and better integration of travel information and ticket purchasing via delivery of the Bus Service Improvement Plan. | High | Short, medium and long-term | The council (City Infrastructure); public transport operators |
| Deliver a modernised bus shelter maintenance contract to improve infrastructure - bus stops, bus shelters, and Real Time Information. | High | Short, medium and long-term | The council (City Infrastructure); public transport operators |
| Continue to support bus services, especially in outlying areas that are not commercially viable. | High | Short, medium and long-term | The council (City Infrastructure); public transport operators |
| Deliverables | Impact on carbon emissions | Timeframe | Key Partners |
|---|---|---|---|
| Deploy smart technologies for the efficient movement of vehicle traffic throughout the city. This includes upgrading junctions to utilise MOVA (Microprocessor Optimised Vehicle Actuation) and SCOOT (Split Cycle Offset Optimisation Technique) for efficient movement of vehicle traffic throughout the city. | Low | Short-term | The council (Traffic Control) |
| Deliverables | Impact on carbon emissions | Timeframe | Key Partners |
|---|---|---|---|
| Utilising the city’s air quality monitoring capabilities expanded in 2024 and 2025, strengthen public communications and awareness to encourage household-level and local business reductions in emissions from heating and transport. | Low | Short-term | The council (City Infrastructure) |
| Deliver education on sustainable travel and empower young people to take climate action via the Our City Our World programme ‘Transport’ theme and assembly programme. | Medium | Short-term | Our City Our World (The Living Coast UNESCO Biosphere); the council (Education); local schools |
| Support and encourage the use of sustainable transport in the local visitor economy through the Local Visitor Economy Partnership and The Living Coast UNESCO Biosphere. | Low | Short, medium and long-term | The council (City Infrastructure and VisitBrighton), neighbouring councils, public transport operators, Local Visitor Economy Partnership, The Living Coast UNESCO Biosphere Partnership |
| Develop targeted campaigns and accessible information to promote active travel and opportunities to be active. | Low | Short, medium and long-term | The council (Public Health and City Infrastructure) |
Related Plans and Policies
5.3 Consumption & Waste
Although waste-related emissions account for a relatively small proportion of the city’s direct greenhouse gas footprint, they remain a crucial area for climate action. This is because our waste systems are closely linked to a broader set of indirect, consumption-based emissions - those generated throughout the lifecycle of goods and services we use, from production to disposal. These consumption-based emissions are significant and distinct from the city’s waste emissions, yet both are influenced by how we manage materials and resources.
While the council is not directly responsible for all these emissions, we can use our influence and partner with community-led initiatives to reduce them. By improving recycling services, and promoting sharing and reuse, we can lower emissions embedded in our consumption and support a shift toward a circular economy. Engaging communities in these sustainable practices is vital to delivering our climate goals.
The council is taking the following actions to tackle greenhouse gas emissions from consumption and waste.
Timeframes: Short (2026 to 2028); Medium (2028 to 2030); Long (2030 onward)
| Deliverables | Impact on carbon emissions | Time frame | Key Partners |
|---|---|---|---|
| Explore funding and development opportunities to create additional circular economy hubs.  | Low | Medium-term | The council (Cabinet Office), Southeast England Hub for Circularity (SEEH4C) |
| Implement the Orbis Environmentally Sustainable Procurement Policy and continue to require the use of the council’s Specification-writing Tool for Environmental Procurement (STEP) on all procurements over £1 million. | Enabling action | Short, medium and long-term | The council (Procurement, All Departments) |
| Encourage the adoption of low-carbon, circular construction practice via the implementation of Policy CP8 in the currently adopted City Plan (2016), Policy WMP3 and RM0 in the Waste & Minerals Local Plan, and Policies DM18 and DM44 in City Plan Part Two. | Medium | Short-term | The council (Planning) |
| Dependent upon the outcomes from government planning reforms, embed circular economy principles in the new City Plan. | Medium | Medium-term | The council (Planning) |
| Encourage circular living, such as avoidance, borrowing, sharing, repair, and reuse, via delivery of the council’s Circular Economy Routemap and Action Plan. | Low | Short, medium and long-term | The council (Cabinet Office, Education, Environmental Services, Communications); Our City Our World (The Living Coast UNESCO Biosphere); Local schools; Trust for Developing Communities |
| Deliverables | Impact on carbon emissions | Time frame | Key Partners |
|---|---|---|---|
| Continue redirecting surplus food to the city’s emergency food services via the Surplus Food Network. | Medium | Short, medium and long-term | The council (Economic Development, Community Engagement; FareShare Sussex; Sussex Gleaning Network; UK Harvest; Brighton & Hove Food Partnership; Real Junk Food Project Brighton; Sussex Homeless Support; and the 50 member organisations of the Emergency and Affordable Food Network |
| Reduce food waste in schools via the Food Use Places Project and the Our City Our World education programme. | Low | Short-term | Brighton & Hove Food Partnership; National Lottery Fund; Real Junk Food Project; Brighton Table Tennis Club; Our City Our World education programme (The Living Coast UNESCO Biosphere); school caterers; the council (Procurement) |
| Prevent food waste in restaurants, cafes and other venues via delivery of the Circular Economy Routemap and Action Plan and the City’s Food Strategy Action Plan (2025-2030). | Medium | Short and medium-term | Restaurants, cafes, caterers, hotels, event venues; the council (Cabinet Office and VisitBrighton); Brighton & Hove Food Partnership; Restaurants Brighton; Universities; Business IP Centre |
| Deliverables | Impact on carbon emissions | Time frame | Key Partners |
|---|---|---|---|
| Monitor and improve performance of domestic food waste collections | Low | Short, medium and long-term | The council (Environmental Services) |
| Continue to increase the range of recyclable materials accepted through household collections. | Low | Short-term | The council (Environmental Services) |
| Deliver communications campaigns to reduce contamination of recycling. | Low | Medium-term | The council (Environmental Services) |
Related Plans and Policies
6. Action Plan Part 2 - Climate change adaption
As climate change intensifies, adapting to its impacts is essential to protect the health, wellbeing, and livelihoods of everyone in Brighton & Hove. The UK is already experiencing rising food insecurity driven in large part by climate change, as well as more frequent and severe weather events—from heatwaves and droughts, to flooding and coastal erosion. As a coastal city located in the South of England, Brighton & Hove faces the dual risk of sea level rise and worsening water stress. Over 46,000 people are at risk of flooding, including 2,571 non-residential properties 9.2km of A roads, 8km of railway, and 107 listed buildings. Existinghigh temperatures already pose a “high” level risk to local agricultural productivity, health and wellbeing, biodiversity, and transport infrastructure and service delivery, with emerging risks to education and building fabric[1]. These risks bring the need for climate change adaptation into sharp focus.
In 2024 we delivered a Climate Risk and Vulnerability Assessment (CRVA) to help identify and prioritise adaptation actions outlined below. The CRVA identifies key risks to our communities, infrastructure, and natural environment, and highlights the need for co-ordinated local action. We are working across council services and with partners to build resilience into our homes, streets, public spaces, and ecosystems. But adaptation is not just the responsibility of the council—everyone has a role to play, from residents and businesses to developers and service providers. Together, we must act now to reduce risks, protect vulnerable people, and safeguard the future of our city.
6.1 Nature-based solutions for climate resilience
Nature is at the heart of our city’s climate resilience. This is called a Natural Capital approach, which means recognising the value of our local natural environment like green spaces, grasslands, scrub, woodlands, soils, and water as essential assets that support our health, wellbeing, and resilience. Through the Climate Risk and Vulnerability Assessment, we have identified that ‘nature-based solutions’, such as restoring habitats and improving land management, are among the most effective ways to reduce risks like flooding, heatwaves, and ecosystem failure. By investing in nature, we are not only protecting the environment, but we are also helping communities thrive in the face of climate change.
Many Sustainable urban Drainage Systems (SuDS), such as raingardens and permeable surfaces, are excellent examples of nature-based solutions. SuDS help slow the flow of surface water, increase attenuation, and reduce pollutants entering groundwater. In doing so, SuDS protect the local chalk aquifer, Brighton & Hove’s main source of drinking water, whilst also mitigating flood risk, enhancing local biodiversity, and delivering public realm improvements. For this reason, the council and its partners are integrating SuDS into schools, parks, and streets across the city.
Central to this work is The Aquifer Project (TAP) - a collaboration between the council, The Living Coast UNESCO Biosphere, South Downs National Park Authority, Southern Water, and the Environment Agency. TAP protects the Brighton Chalk Aquifer by co-ordinating efforts to reduce pollution and improve water resilience. From education, public campaigns, regenerative farming and urban rainscapes, TAP ensures that protecting our aquifer remains a priority in how we plan, build, and adapt our city.
The council and its partners are taking the following actions to increase and improve the provision of SuDS and other nature-based solutions that strengthen the city’s resilience in a changing climate.
Timeframes: Short (2026 – 2028); Medium (2028 – 2030); Long (2030 onward)Associated risks of current risk level key: N = Natural Environment and Assets, H = Health, Communities, and the Built Environment, I = Infrastructure, B = Business and Industry. Full risk reference table: Appendix A - UK Climate Risk (2021) risk references
| Deliverables | Associated risks and current risk level | Timeframe | Key Partners |
|---|---|---|---|
|
Develop a blue-green infrastructure implementation and investment plan that embeds climate change adaptation, ensuring consideration of:
The implementation and investment plan will help to deliver Local Natural Recovery Strategy (LNRS) priorities, inform the City Plan and Open Spaces Strategy review, and support UNESCO Sustainable Development goals. |
N1 (Significant) H1 (High) H3 (Significant) H7 (Significant) I2 (High) |
Medium-term | The council (Net Zero Team, CityParks, Transport Projects & Engineering, Planning, Property, Public Health, Outdoor events - Cemeteries); The Living Coast UNESCO Biosphere; South Downs National Park Authority; Sussex Nature Partnership; Southern Water; The Aquifer Project. |
| Deliver and monitor programmes to improve our planting resilience, such as Black Rock planting to prevent coastal erosion, and Elm tree inoculation programme. |
N1 (High) N17 (Significant) |
Medium-term | The council (CityParks, Seafront) |
| Deliverables | Associated risks and current risk level | Timeframe | Key Partners |
|---|---|---|---|
| Continue to deliver The Aquifer Project programme of activities to protect and improve the quality of groundwater in the Brighton chalk aquifer as a sustainable resource for public water supply. |
N1 (High) N4 (High) H3 (High) H5 (Significant) H10 (Significant) I2 (High) I8 (significant) B1 (High) |
Short, medium and long-term | The Aquifer Project; The Living Coast UNESCO Biosphere; the council (Property); Farmers |
| Deliver a ‘Depave’ campaign to raise awareness of paving-related planning conditions, and encourage residents, communities and organisations to exchange existing hard surfaces such as patios, paved-over gardens and pavements for a permeable surface that allows water to flow through. |
N1 (High) N4 (High) H3 (High) H5 (Significant) H10 (Significant) I2 (High) B1 (High) |
Short and medium-term | The Aquifer Project; The Living Coast UNESCO Biosphere; the council (Transport Projects, Engineering and Parking) |
| Deliverables | Associated risks and current risk level | Timeframe | Key Partners |
|---|---|---|---|
| Deliver city-wide Highways Sustainable urban Drainage Schemes (SuDS) to protect highways and properties from surface water flooding and extreme weather events, and to protect the chalk aquifer and improve biodiversity. |
N1 (High) N4 (High) H3 (High) H5 (Significant) H10 (Significant) I2 (High) I8 (significant) B1 (High) |
Short, medium and long-term | The council (City Infrastructure); Southern Water |
| Deliverables | Associated risks and current risk level | Timeframe | Key Partners |
|---|---|---|---|
| Continue our programme of street tree maintenance and tree planting through the delivery of our Tree Planting Plan 2022-27. |
N1 (High) N2 (Moderate) N4 (High) N6 (High) I2 (High) I12 (High) B1 (High) B5 (Significant) H1 (High) H7 (Significant) |
Short, medium and long-term | The council (CityParks: Arboriculture, City Infrastructure) |
| Work with communities and businesses to consider new opportunities for urban planting, which are resilient and sustainable. |
N1 (High) N2 (Moderate) N4 (High) N6 (High) I2 (High) I12 (High) B1 (High) B5 (Significant) H1 (High) H7 (Significant) |
Short, medium and long-term | The council (Place Making, Culture and Environment, Housing, City Infrastructure, Communications, Commissioning and Communities) |
Related Plans and Policies
- Climate Risk and Vulnerability Assessment
- Flood Risk Map
- Urban Heat Island study
- Green Infrastructure Study
- Sussex Local Nature Recovery Strategy
- City Plan Part 2: Policy DM37 Green Infrastructure and Nature Conservation
- City Plan 2041 Key Issues Consultation
- Flood and drainage policies
- Brighton & Hove Coastal Management Policies
- Shoreline Management Plan
- City Downland Estate Plan
6.2 Improving water efficiency to safeguard future water supply
Water stress in the South of England is becoming an increasingly urgent issue due to a combination of climate change, population growth, and over-abstraction of water resources. The region experiences lower annual rainfall compared to other parts of the UK, yet it supports a dense population and intensive agricultural activity. As demand continues to rise, rivers and aquifers are under pressure, leading to ecological degradation and reduced water availability.
The council and its partners are taking the following actions to improve water efficiency in Brighton & Hove, safeguarding water supply for future generations.
Timeframes: Short (2026 – 2028); Medium (2028 – 2030); Long (2030 onward)Associated risks of current risk level key: N = Natural Environment and Assets, H= Health, Communities, and the Built Environment, I = Infrastructure, B = Business and Industry. Full risk reference table: Appendix A - UK Climate Risk (2021) risk references
| Deliverables | Associated risks and current risk level | Timeframe | Key Partners |
|---|---|---|---|
| Encourage best practice in sustainable drainage in the design and layout of new buildings, car parking and hard standing through the implementation of City Plan Part 1 Policy CP11 Managing Flood Risk, City Plan Part 2 DM43 Sustainable Drainage, the Urban Design Framework SPD and the Sustainable Drainage SPD. |
H5 (Significant) H1 (High) H3 (Significant) I8 (Significant) |
Short-term | The council (Planning) |
| Deliverables | Associated risks and current risk level | Timeframe | Key Partners |
|---|---|---|---|
| Continue corporate water efficiency programme through installation of automatic metering, water-saving equipment and timely leak identification and repair. Continue partnership with Southern Water for grant funding opportunities related to water usage reduction and efficiency. |
N1 (High) N4 (High) H10 (Significant) |
Short, medium and long-term | The council (Net Zero Team, Infrastructure) |
| Deliverables | Associated risks and current risk level | Timeframe | Key Partners | |
|---|---|---|---|---|
| Work with tenant farmers to explore climate-resilient agriculture and water protection practices. |
N1 (High) N4 (High) N18 (Significant) H5 (Significant) H10 (Significant) I2 (High) I8 (significant) B1 (High) |
Short and medium-term | The council (Estates); The Aquifer Project; The Living Coast UNESCO Biosphere; South Downs National Park Authority; farmers. |
Related Plans and Policies
- Climate Risk and Vulnerability Assessment
- City Plan Part 2: Policy DM37 Green Infrastructure and Nature Conservation
- City Plan 2041 Key Issues Consultation
- City Downland Estate Plan
6.3 Regional infrastructure
Regional infrastructure in and around Brighton & Hove - such as transport networks, utilities, and public buildings - faces increasing threats from climate change, including sea level rise, flooding, extreme heat, and drought. The Climate Risk and Vulnerability Assessment (CRVA) highlights the urgent need to adapt and protect critical infrastructure to ensure it remains functional and safe under future climate conditions. Without proactive adaptation, these systems risk disruption, damage, and failure, which could severely impact residents, businesses, and essential services. Strengthening infrastructure resilience is therefore vital to safeguard the city’s economy, public health, and overall quality of life.
Coastal erosion is a critical climate risk that threatens the city’s key cultural, natural and economic asset - its seafront. England’s Flood and Coastal Erosion Risk Management strategy, led by the Environment Agency, provides a co-ordinated national framework that defines our local actions and measurable outcomes. In Brighton & Hove, this framework has delivered a decade of collaborative work with stakeholders like the Shoreham Port Authority and neighbouring authorities to address shoreline challenges. Our approach to shoreline management will continue to focus on effective use of climate data, carbon reduction, and biodiversity goals into coastal protection efforts, moving beyond traditional hard engineering to also embrace nature-based solutions. We recognise that safeguarding the coast is inseparable from the city’s strategic priorities, including sustainability, accessibility, and resilience. The formation of the Seafront Development Board underscores the growing momentum to act decisively in the face of escalating climate threats to our coastlines.
The council and its partners are taking the following actions to tackle coastal erosion and protect critical infrastructure in a changing climate.
Timeframes: Short (2026 – 2028); Medium (2028 – 2030); Long (2030 onward)Associated risks of current risk level key: N = Natural Environment and Assets, H= Health, Communities, and the Built Environment, I = Infrastructure, B = Business and Industry. Full risk reference table: Appendix A - UK Climate Risk (2021) risk references
| Deliverables | Associated risks and risk level | Timeframe | Key Partners |
|---|---|---|---|
| Implement coastal protection measures guided by the Southdowns Shoreline Management Plan, including shingle replenishment, groynes, and strategic schemes from Brighton Marina to Saltdean and Brighton Marina to River Adur. |
N10 (Moderate) N14 (Significant) N16 (Significant) N17 (Significant) H3 (High) I3 (Significant B2 (Significant) |
Short, medium and long-term | The council (Civil Infrastructure, City Infrastructure); Lewes District Council; Adur & Worthing Councils; Environment Agency |
| Deliverables | Associated risks and risk level | Timeframe | Key Partners |
|---|---|---|---|
| Update infrastructure design and maintenance plans for council assets to include climate risk and adaptation considerations. | Not applicable - enabling | Medium-term | The council (Net Zero Team, Transport Projects and Engineering, Housing (planned) Repairs, Estates) |
| Refurbish and retrofit the council’s built assets to reduce overheating (including social housing and schools). |
H1 (High) H5 (Significant) H12 (Significant) H13 (Significant) |
Long-term | The council (Housing maintenance, Estates, Net Zero Team) |
| Deliverables | Associated risks and risk level | Timeframe | Key Partners |
|---|---|---|---|
| Use knowledge of future developments to support and influence the adaptation of key regional infrastructure (transport, water and wastewater management, electricity, gas and digital infrastructure) to future climate change. |
I1 (High) I2 (High) I3 (High) I5 (Significant) I8 (Significant) I10 (Significant) I12 (Significant) I13 (Significant) N10 (Significant) |
Short, medium and long-term | The council (Net Zero Team, Planning); Mayoral County Combined Authority; neighbouring councils; Southern Water; National Highways; bus operators; train companies; Network Rail, Great British Railways; UK Power Networks; energy companies; telecommunications and ICT providers |
| Address climate change adaptation in the refresh of the Heritage Strategy and develop a targeted plan to secure long-term viable uses for historic sites in collaboration with Historic England. |
H5 (Significant) H1(High) H3 (High) I8 (Significant) |
Short term | The council (Planning, Estates); Historic England |
Related Plans and Policies
- Climate Risk and Vulnerability Assessment
- Shoreline Management Plan
- Brighton Marina to Saltdean and Brighton Marina to River Adur
- Brighton Marina to Portslade-by-Sea 4D12 | Shoreline Management Plans
- Heritage Strategy
6.4 Public health and emergency response
Climate change is placing growing pressure on both public health and emergency response systems in Brighton & Hove, with vulnerable groups – such as older adults, children, low-income and disabled residents, and people with pre-existing health conditions – most at risk.
Both climate change and the long-term decline in the UK’s natural capital (biodiversity, healthy soils and clean water) are pressing risks to UK food production. Household food bills increased by an average of £605 across the two years 2022 and 2023, with climate change accounting for nearly 60% of the price rise. UK food prices are predicted to rise by another third by 2050 due to the domestic and global effects of climate change.
Rising temperatures and worsening air quality increase the incidence of heat-related illness, cardiovascular morbidity and mortality, and respiratory conditions, while changing ecosystems may lead to the emergence of vector-borne diseases like Lyme disease, increasing pressures on the NHS and social care system.
Emergency response systems must also be strengthened to cope with the increasing frequency and severity of climate-related events such as flooding, storms, and heat emergencies. These events can disrupt access to healthcare, delay emergency services, and strain co-ordination efforts.
Adapting public health services and strengthening emergency preparedness - through improved infrastructure, targeted training, and inclusive community engagement - is essential to protect those most at risk and maintain effective response capabilities in the face of escalating climate threats.
The council and its partners are taking the following actions to protect public health and enhance emergency response in a changing climate.
Timeframes: Short (2026 – 2028); Medium (2028 – 2030); Long (2030 onward)Associated risks of current risk level key: N = Natural Environment and Assets, H= Health, Communities, and the Built Environment, I = Infrastructure, B = Business and Industry. Full risk reference table: Appendix A - UK Climate Risk (2021) risk references
| Deliverables | Associated risks and current risk level | Timeframe | Key Partners |
|---|---|---|---|
| Continue to monitor and communicate risks of climate-sensitive infections - such as tick-borne diseases and mosquito-borne illnesses - through public awareness campaigns, surveillance, and UK Health Security Agency (UKHSA)-aligned prevention messaging. |
H1 (High) H12 (Significant) H7 (Significant) |
Short, medium and long-term | Brighton & Hove Health and Wellbeing Board; University Hospitals Sussex NHS Foundation Trust; the council (Public Health); UKHSA; The Living Coast UNESCO Biosphere. |
| Deliverables | Associated risks and current risk level | Timeframe | Key Partners |
|---|---|---|---|
| Continue to disseminate the early warning system and emergency response plan for extreme weather events, linking with the Adverse Weather and Health Plan and Flood Risk Management Strategy. |
H1 (High)H3 (High) H12 (Significant) |
Short, medium and long-term | The council (Emergency Planning Team); University Hospitals Sussex NHS Foundation Trust; Emergency Services; Sussex Resilience Forum |
| Promote public drinking water facilities and warm and cool spaces. Continue to disseminate the ‘cool spaces map’ to communicate locations where people can go during extreme heat events to access cool conditions. |
H1 (High) H12 (Significant) H7 (Significant) H6 (Moderate) |
Short and medium-term | The council (Emergency Planning Team, Libraries, Communications) |
| Co-develop and disseminate resources for event organisers to better understand their climate risks and impacts and contribute to policies and solutions that will enable locally important events to continue safely under changing weather conditions. |
H1 (High)H3 (High) H12 (Significant) |
Medium-term | The council (Outdoor Events Team and VisitBrighton); local businesses |
| Deliverables | Associated risks and current risk level | Timeframe | Key Partners |
|---|---|---|---|
| Continue to support the Surplus Food Network to co-ordinate policy and action across the city, to reduce food waste and improve food resilience. |
H9 (Not rated) ID1 (Not rated) ID2 (Not rated) |
Medium-term | Brighton & Hove Food Partnership; Surplus Food Network; the council (Cabinet Office, Commissioning and Communities, Community Engagement) |
| Work with Sussex Resilience Forum to develop regional civil food resilience plans. |
H9 (Not rated) ID1 (Not rated) ID2 (Not rated) |
Long-term | Food Insecurity Group: the council (Public Health, Temporary and Supported Accommodation, Revenue and Benefits, Cabinet Office, School Meals); NHS Sussex; Family Hubs; Brighton & Hove Food Partnership; Community Works; Citizens Advice Brighton & Hove |
| Deliverables | Associated risks and current risk level | Timeframe | Key Partners |
|---|---|---|---|
| Review Air Quality Management Area (AQMA) designations together with risk areas identified from the Urban Heat Island modelling and develop new Air Quality Action Plan (AQAP). |
H1 (High) H7 (Significant) |
Medium-term | The council (City Infrastructure) |
| Campaign to raise awareness of risks of wood burning stoves. |
H1 (High) H7 (Significant) |
Short-term | The council (City Infrastructure, Public Health) |
Related Plans and Policies
- Climate Risk and Vulnerability Assessment
- Brighton & Hove Food Strategy (2025-2030)
- Air Quality Action Plan 2022
- Health and Wellbeing Strategy Brighton & Hove 2019 - 2030
- Joint Strategic Needs Assessment JSNA Review 2023.pdf
- NHS Sussex - Improving Lives Together 2023
- Let’s Get Moving - Physical activity and sports strategy 2024.pdf
- Sustainable Outdoor Event Commitment
6.5 Partnerships to enhance adaptation action
The council is taking the following actions to contribute towards and strengthen local and regional partnerships delivering climate change adaptation.
Associated risks of current risk level key: N = Natural Environment and Assets, H = Health, Communities, and the Built Environment, I = Infrastructure, B = Business and Industry. Full risk reference table: Appendix A - UK Climate Risk (2021) risk references
| Deliverables | Associated risks and current risk level | Timeframe | Key Partners | |
|---|---|---|---|---|
| Build capacity, capabilities and knowledge within the council and community to deliver projects and develop policies to improve the city’s resilience to climate change. | Not applicable - enabling action | Short, medium and long-term | The council (Net Zero Team, CityParks, Transport Projects & Engineering, Place Making, Housing, Planning, Public Health, Emergency Planning) | |
| Work with emerging MCCA to facilitate the establishment of a climate adaptation lead, to engage with Defra’s advisory panel, strengthen governance, align strategies, secure funding, and collaborate with key stakeholders to enhance regional climate resilience. | Not applicable - enabling action | Medium-term | The council (Net Zero Team) or Mayoral Combined County Authority; Local Adaptation Advisory Panel - DEFRA | |
| Contribute to regional climate impact initiatives. These could include overseeing adaptation efforts, aligning with mitigation actions, preparing communities for necessary adaptation changes, and strengthening resilience in public health, infrastructure, economy, and the environment. | Not applicable - enabling action | Long-term | Mayoral Combined County Authority; the council (Net Zero Team, Public Health, Emergency Planning, Transport Projects & Engineering, CityParks, Planning); neighbouring Councils; Environment Agency; Met Office; Natural England; Southern Water; South East Water; Network Rail; Sussex Resilience Forum (i.e. emergency services); University Hospitals Sussex NHS Foundation Trust; The Living Coast UNESCO Biosphere; Sussex Wildlife Trust; SDNP, Adur & Ouse Catchment Partnership; Ouse and Adur Rivers Trust; and local universities |
| Deliverables | Associated risks and current risk level | Timeframe | Key Partners | |
|---|---|---|---|---|
| Deliver the £1.3 million Climate for Communities project to build climate resilience in Brighton & Hove, by empowering neighbourhoods through education, circular economy actions, local engagement, and co-ordinated campaigns. Targeted activities and workshops delivered in four high-need areas: Moulsecoomb & Bevendean, East Brighton, Hangleton & Knoll, North Portslade. | Not applicable - enabling action | Short-term | Trust for Developing Communities (lead partner); the council (Net Zero Team, Education and Learning - Our City Our World programme, Cabinet Office, The Living Coast UNESCO Biosphere Team) and many other local partners including Community Works and Climate Outreach | |
| Develop a public communications and engagement programme to raise awareness of multiple audiences including residents, school children, engineering professionals and farmers to protect our chalk aquifer which provides the city’s drinking water. | Not applicable - enabling action | Short- and medium-term | The Living Coast UNESCO Biosphere, The Aquifer Project, the council (Net Zero Team, Communications, Education and Learning, Flood Risk and Sustainable Drainage), Southern Water, The Environment Agency, South Downs National Park Authority, the University of Brighton | |
| Work with schools, universities, and local organisations to embed climate adaptation and sustainability education across the city - through whole-school programmes, youth ambassador initiatives, hands-on activities like gardening and composting, and curriculum partnerships - empowering young people to take informed action and contribute to a more equitable, resilient future. | Not applicable - enabling action | Short and medium-term | The Living Coast UNESCO Biosphere, the council (Education and Learning, Net Zero Team), local schools, Brighton Energy Coop, The Aquifer Project, the University of Brighton, the University of Sussex, Brighton & Hove Food Partnership | |
| Promote climate resilience with local tourism businesses through the work of VisitBrighton and the Local Visitor Economy Partnership, aligning with the work of VisitEngland. |
B1 (High risk) B2 (Significant risk) B5 (Significant risk) |
Short, medium and long-term | The council (VisitBrighton, Net Zero Team), Brighton & Hove Chamber of Commerce, Brighton & Hove Economic Partnership | |
| Continue to deliver The Living Coast UNESCO Biosphere programme of public events & communications including regular knowledge and best practice sharing, nature connection, engagement events and volunteering opportunities. | Not applicable - enabling action | Short and medium-term | The Living Coast UNESCO Biosphere Partnership; the council (Net Zero Team) | |
Related Plans and Policies
7. Action Plan Part 3 - Nature restoration and enhancement
Government has set out an ambition to create a ‘Nature Recovery Network’ of wildlife-rich places across England: expanding, improving and connecting places for wildlife across our cities, towns, countryside and coast. The Environment Act (2021) introduced a new locally-driven approach to help make this happen: Local Nature Recovery Strategies (LNRSs). This is alongside requirements in planning for Biodiversity Net Gain for all new developments to achieve 10 % improvement.
The East Sussex and Brighton & Hove Local Nature Recovery Strategy is due to be published in March 2026 and sets out the principles, priorities and core measures (with associated enabling measures) to drive local nature recovery across all habitats including farmland, species-rich grasslands, coastal, urban, and woodland, hedgerows and scrub. It also identifies and strategically maps areas that could become of particular importance for biodiversity, which can help direct where to concentrate efforts and aligning with Biodiversity Net Gain planning requirements.
Key to delivery is The Living Coast, a UNESCO Biosphere designation, which recognises the international importance of our environment and is the UK’s only urban biosphere. With Brighton & Hove at the centre, the Biosphere stretches from Worthing in the West, to Seaford in the East, continuing North over the South Downs National Park. The unique designation and partnership connects people and nature and helps promote and deliver biodiversity conservation and sustainable development.
7.1 Restoring nature in the city
Nature in our city is under pressure—but it’s also full of potential. Brighton & Hove is home to an extraordinary range of natural habitats, from coastal waters to chalk downland and city parks to street trees. This action plan sets out how we will work to protect, restore and connect urban green spaces, support wildlife, and create a healthier biosphere. Together, we’re building a greener, more resilient city where nature is part of everyday life.
The council is taking the following actions to restore nature in the city.
Timeframes: Short (2026 – 2028); Medium (2028 – 2030); Long (2030 onward)
| Deliverables | Contribution to LNRS Core and Enabling Measures* | Timeframe | Key Partners |
|---|---|---|---|
| Actions supporting LNRS measures include tree and wildflower planting, improving urban green corridors, parks and greenspace management and actions to protect the chalk aquifer. Further enabling measures for delivery include community engagement, advice for farmers and landowners, officer training, and strengthening local and regional partnerships. | High | Short, medium and long-term | The council (Net Zero Team, CityParks, Place Making, Seafront, Transport Projects & Engineering, Housing teams); The Living Coast UNESCO Biosphere; Wild Flower Conservation Society |
| Deliverables | Contribution to LNRS Core and Enabling Measures* | Timeframe | Key Partners |
|---|---|---|---|
| Depending on national requirements, explore implementation of policies around urban greening and BNG on certain sites through City Plan review. | High | Short-term | The council (Planning, Net Zero Team) |
| Deliverables | Contribution to LNRS Core and Enabling Measures* | Timeframe | Key Partners |
|---|---|---|---|
| Plan, develop and deliver a new Parks and Open Spaces strategy as part of the Blue-Green Infrastructure Plan, taking a natural capital approach to enhance, protect and expand access to our city-owned parks and open spaces, with a focus on improving climate resilience and nature restoration. | High | Short and medium-term | The council (CityParks) |
| Deliverables | Contribution to LNRS Core and Enabling Measures* | Timeframe | Key Partners |
|---|---|---|---|
| Expand the residential street opt-out scheme for chemical weed control. Monitor street vegetation to keep glyphosate use to the minimum required for safe and accessible streets. Introduce cultural practices for fine sports turf management to reduce use of chemical fertilisers. Monitor plant health and growth to optimise water and nutrient use. Test and adopt organic and biostimulant alternatives to chemical fertilisers. | Low | Short and medium-term | The council (Environmental Services, CityParks) |
| Deliverables | Contribution to LNRS Core and Enabling Measures* | Timeframe | Key Partners |
|---|---|---|---|
| Continue delivery and management of biodiversity projects, including Greening the Cities Wilder Verges, restoration of Falmer Pond, local conservation grazing, and habitat management. | High | Short and medium-term | The Living Coast UNESCO Biosphere; the council (CityParks, Net Zero Team, Communities) |
| Deliverables | Contribution to LNRS Core and Enabling Measures* | Timeframe | Key Partners |
|---|---|---|---|
| Build on the learning and remaining opportunities from the 2014–2024 Allotment Strategy to deliver achievable, high‑value improvements that benefit tenants, strengthen community food resilience, and support climate‑adapted growing practices. | Low | Short-term | The council (CityParks); Brighton & Hove Food Partnership; Brighton Permaculture Trust |
| Explore opportunities around right to grow linked to City Plan review. | Low | Short-term | The council (Planning) |
| Support existing and emerging community garden initiatives, where appropriate and resources allow. | Low | Short-term | The council (CityParks, Planning, and Community Engagement, Commissioning and Communities); Brighton Permaculture Trust |
| Promote and support community composting schemes. | Low | Short and medium-term | Brighton & Hove Food Partnership; the council (CityParks) |
| Deliverables | Contribution to LNRS Core and Enabling Measures* | Timeframe | Key Partners |
|---|---|---|---|
|
Maintain Blue Flag status for beaches. Manage and aim to expand coastal habitats valuable for nature such as Coastal Vegetated Shingle. |
Medium | Short-term | The Living Coast UNESCO Biosphere; Southern Water; Greater Brighton; Sussex Bay; the council (Seafront team). |
| Deliverables | Contribution to LNRS Core and Enabling Measures* | Timeframe | Key Partners |
|---|---|---|---|
| Support the city’s early years and childcare providers to provide high quality early years services including positive promotion of natural environment and outdoor learning. | Medium | Short, medium and long-term | The council (Education and Learning); Nurseries; Local schools; The Living Coast UNESCO Biosphere; Our City Our World. |
| Deliverables | Contribution to LNRS Core and Enabling Measures* | Timeframe | Key Partners |
|---|---|---|---|
|
Develop appropriate management and monitoring plans. Explore opportunities to connect important sites for nature through creation of new habitat, green networks and stepping stones. |
High | Short, medium and long-term | The council (Net Zero Team, CityParks); The Living Coast UNESCO Biosphere; Local Wildlife Sites Initiative; Sussex Local Nature Partnership |
| Deliverables | Contribution to LNRS Core and Enabling Measures* | Timeframe | Key Partners |
|---|---|---|---|
| Continue to implement and expand the annual elm inoculation programme. Replace lost elms with new trees, including disease-resistant elms and other suitable species to improve overall resilience. Deliver the Elm Propagation Project to protect rare elm varieties for the future. | High | Short, medium and long-term | The council (CityParks); Woodland Trust; CPRE; Plant Heritage; Plumpton College; The Conservation Foundation |
| Continue replacement of lost street trees and work across departments to seek opportunities for new street tree planting, via delivery of the Tree Planting Plan 2022-27. | Medium | Short-term | The council (CityParks, Transport Projects & Engineering, Placemaking); Woodland Trust; CPRE; Plant Heritage; Plumpton College |
| Deliverables | Contribution to LNRS Core and Enabling Measures* | Timeframe | Key Partners |
|---|---|---|---|
| Continue enforcement of City Plan Part One (Policy CP10) and Supplementary Planning Document (SPD11) requiring eligible developments to install swift bricks. | Low | Short-term | The council (Planning, CityParks, Place Making) |
*Based on review of draft LNRS measures published Spring 2025.
Related Plans and Policies
- Open Spaces Strategy (2017)
- BHCC Tree Planting Plan 2022-27
- The Living Coast UNESCO Biosphere Sustainable Futures 2025-2034 report
- Brighton & Hove Food Strategy Action Plan 2025-2030
- City Plan Part 2: Appendix 3 – Local Wildlife Sites (Policy DM37 Green Infrastructure and Nature Conservation)
- Biodiversity and Nature Conservation SPD11
- Local Nature Recovery Strategy (East Sussex and Brighton & Hove)
- Brighton & Hove Green Infrastructure Study
7.2 Restoring nature in the City Downland Estate
The Brighton & Hove City Downland Estate is a publicly owned landscape of over 5,200 hectares surrounding the city and within the South Downs National Park. This land was purchased by the council in the early 1900s to protect the city’s drinking water supply and control urban development. Today, most of the land is tenanted to farms, with farmers acting as key stewards of the estate - supporting biodiversity, sustainable food production, the local economy, and public access to nature. Managed through the City Downland Estate Plan, the council works closely with farmers, communities, and partners to ensure the land delivers long-term benefits for climate, nature, and outdoor access.
The council is taking the following actions to deliver nature in the City Downland Estate.
Timeframes: Short (2026 – 2028); Medium (2028 – 2030); Long (2030 onward)
| Deliverables | Contribution to LNRS Core and Enabling Measures * | Timeframe | Key Partners |
|---|---|---|---|
| Continue to deliver the City Downland Estate Plan and progress towards the vision of a climate resilient and biodiverse landscape fully restored and teeming with wildlife. | High | Short, medium and long-term | The council (Estates); The Living Coast UNESCO Biosphere; South Downs National Park Authority; National Trust |
| Develop key performance indicators for the City Downland Estate. | Enabling action | Short-term | The council (Estates and Net Zero Team) |
| Deliverables | Contribution to LNRS Core and Enabling Measures * | Timeframe | Key Partners |
|---|---|---|---|
| Encourage tenant farmers and land managers to work with the council to prepare and deliver plans which include regenerative agriculture, habitats, climate resilience, greenhouse gas emission reductions, and water quality protection. | High | Short and medium-term | The council (Estates); the council’s tenant farmers; South Downs National Park Authority; Natural England. |
| Continue to work with stakeholders to support sustainable food production and develop markets for sustainably produced local food through the Local Food Growth Plan. | Low | Short, medium and long-term | The council (Estates, Economic Development); Brighton & Hove Food Partnership; South Downs National Park Authority; The Living Coast UNESCO Biosphere |
| Deliverables | Contribution to LNRS Core and Enabling Measures * | Timeframe | Key Partners |
|---|---|---|---|
|
Develop Habitat Bank opportunities across the City Downland Estate to enhance and improve habitats through BNG and other potential contributions. Build on and share learning from the highly successful Changing Chalk project including the Wilding Waterhall project, to develop new initiatives restoring and improving habitats within urban and downland environment. With partners, monitor performance of the Wild Park Rainscape project and apply learning to future projects. |
High | Medium-term | The council (Estates, Net Zero Team, Transport Projects & Engineering); The Living Coast UNESCO Biosphere; TAP; National Trust Changing Chalk partnership; Southern Water; University of Brighton |
| Deliverables | Contribution to LNRS Core and Enabling Measures * | Timeframe | Key Partners |
|---|---|---|---|
| Complete the development of the Stanmer Park Masterplan and include objectives and actions on organic farming, biodiversity and climate resilience. | Low | Short-term | The council (CityParks, Estates); South Downs National Park Authority; Historic England |
*Based on review of draft LNRS measures published Spring 2025.
Related Plans and Policies
- City Downland Estate Plan
- Local Nature Recovery Strategy
- Brighton & Hove Food Strategy
- Sustain's Local Food Growth Plan - 2025
- Changing Chalk project | Sussex | National Trust
7.3 Financing local nature recovery projects
Working with our partners, Brighton & Hove City Council is taking steps to unlock new ways of funding nature recovery. This action is vital to support habitat restoration, sustainable land use, and urban greening - bringing benefits for wildlife, cleaner air and water, flood protection, and healthier communities. By developing place-based investment models, we’re helping shape a more resilient and nature-rich future across the city and the wider Sussex region.
The council is taking the following action to finance nature recovery across the city and beyond.
Timeframes: Short (2026 – 2028); Medium (2028 – 2030); Long (2030 onward)
| Deliverables | Contribution to LNRS Core and Enabling Measures* | Timeframe | Key Partners | |||
|---|---|---|---|---|---|---|
| Agree a Local Nature Recovery Strategy (LNRS) and support delivery of measures within Brighton & Hove. | Enabling action High | Short, medium and long-term | The council (Net Zero Team, Planning); neighbouring councils; Sussex Nature Recovery; local nature and community organisations | |||
| Deliverables | Contribution to LNRS Core and Enabling Measures* | Timeframe | Key Partners | |||
|---|---|---|---|---|---|---|
| Develop Habitat Banks to attract investment in local nature recovery projects, enabled by Biodiversity Net Gain planning obligations introduced in 2024, and the sale of voluntary credits. | Enabling action Medium | Medium-term | The council (Planning, Estates, Net Zero Team); South Downs National Park Authority; developers; tenant farmers; Defra | |||
| Establish new vehicle to attract emerging green finance streams, and private donations to ensure long-term, sustainable funding for parks and green spaces. | Enabling action | Short and medium-term | The council (CityParks, Transport Projects and Engineering) | |||
*Based on review of draft LNRS measures published Spring 2025.
Related Plans and Policies
Appendix A - Full list of risks reviewed for the CRVA
| UK Climate Risk (2021) Reference | Description | Scoped in or out of CRVA |
|---|---|---|
| N1 | Risks to terrestrial species and habitats from changing climatic conditions and extreme events, including temperature change, water scarcity, wildfire, flooding, wind, and altered hydrology (including water scarcity, flooding, and saline intrusion). | In |
| N2 | Risks to terrestrial species and habitats from pests, pathogens, and invasive species | In |
| N3 | Opportunities from new species colonisations in terrestrial habitats | Out |
| N4 | Risk to soils from changing climatic conditions, including seasonal aridity and wetness. | In |
| N5 | Risks and opportunities for natural carbon stores, carbon sequestration from changing climatic conditions, including temperature change and water scarcity | Out |
| N6 | Risks to and opportunities for agricultural and forestry productivity from extreme events and changing climatic conditions (including temperature change, water scarcity, wildfire, flooding, coastal erosion, wind, and saline intrusion). | In |
| N7 | Risks to agriculture from pests, pathogens, and invasive species | In |
| N8 | Risks to forestry from pests, pathogens, and invasive species | Out |
| N9 | Opportunities for agricultural and forestry productivity from new/alternative species becoming suitable. | Out |
| N10 | Risks to aquifers and agricultural land from sea level rise, saltwater intrusion | In |
| N11 | Risks to freshwater species and habitats from changing climatic conditions and extreme events, including higher water temperatures, flooding, water scarcity and phenological shifts. | Out |
| N12 | Risks to freshwater species and habitats from pests, pathogens, and invasive species | Out |
| N13 | Opportunities to freshwater species and habitats from new species colonisations | Out |
| N14 | Risks to marine species, habitats, and fisheries from changing climatic conditions, including ocean acidification and higher water temperatures | In |
| N15 | Opportunities to marine species, habitats, and fisheries from changing climatic conditions | Out |
| N16 | Risks to marine species and habitats from pests, pathogens, and invasive species | In |
| N17 | Risks and opportunities to coastal species and habitats due to coastal flooding, erosion, and climate factors | In |
| N18 | Risks and opportunities from climate change to landscape character | In |
| UK Climate Risk (2021) Reference | Description | Scoped in or out of CRVA |
|---|---|---|
| I1 | Risks to infrastructure networks (water, energy, transport, ICT) from cascading failures | In |
| I2 | Risks to infrastructure services from river, surface water and groundwater flooding | In |
| I3 | Risks to infrastructure services from coastal flooding and erosion | In |
| I4 | Risks to bridges and pipelines from flooding and erosion | Out |
| I5 | Risks to transport networks from slope and embankment failure | In |
| I6 | Risks to hydroelectric generation from low or high river flows | Out |
| I7 | Risks to subterranean and surface infrastructure from subsidence | Out |
| I8 | Risks to public water supplies from reduced water availability | In |
| I9 | Risks to energy generation from reduced water availability | Out |
| I10 | Risks to energy from high and low temperatures, high winds, lightning | In |
| I11 | Risks to offshore infrastructure from storms and high waves | Out |
| I12 | Risks to transport from high and low temperatures, high winds, lightning | In |
| I13 | Risks to digital from high and low temperatures, high winds, lightning | In |
| UK Climate Risk (2021) Reference | Description | Scoped in or out of CRVA |
|---|---|---|
| H1 | Risks to health and wellbeing from high temperatures | In |
| H2 | Opportunities for health and wellbeing from higher temperatures | Out |
| H3 | Risks to people, communities, and buildings from flooding | In |
| H4 | Risks to the viability of coastal communities from sea level rise | Out |
| H5 | Risks to building fabric | In |
| H6 | Risks and opportunities from summer and winter household energy demand | In |
| H7 | Risks to health and wellbeing from changes in air quality | In |
| H8 | Risks to health from vector-borne disease | Out |
| H9 | Risks to food safety and food security | Out |
| H10 | Risks to water quality and household water supplies | In |
| H11 | Risks to cultural heritage | In |
| H12 | Risks to health and social care delivery | In |
| H13 | Risks to education and prison services | In |
| UK Climate Risk (2021) Reference | Description | Scoped in or out of CRVA |
|---|---|---|
| B1 | Risks to businesses from flooding | In |
| B2 | Risks to businesses and infrastructure from coastal change from erosion, flooding, and extreme weather events | In |
| B3 | Risks to business from water scarcity | In |
| B4 | Risks to finance, investment and insurance including access to capital for businesses | Out |
| B5 | Risks to business from reduced employee productivity due to infrastructure disruption and higher temperatures in working environments | In |
| B6 | Risks to business from disruption to supply chains and distribution networks | Out |
| B7 | Opportunities for business from changes in demand for goods and services | Out |
| UK Climate Risk (2021) Reference | Description | Scoped in or out of CRVA |
|---|---|---|
| ID1 | Risks to UK food availability, safety, and quality from climate change overseas | Out |
| ID2 | Opportunities for UK food availability and exports from climate impacts overseas | Out |
| ID3 | Risks and opportunities to the UK from climate-related international human mobility | Out |
| ID4 | Risks to the UK from international violent conflict resulting from climate change overseas | Out |
| ID5 | Risks to international law and governance from climate change that will impact the UK | Out |
| ID6 | Opportunities from climate change (including Arctic ice melt) on international trade routes | Out |
| ID7 | Risks associated with international trade routes | Out |
| ID8 | Risk to the UK finance sector from climate change overseas | Out |
| ID9 | Risk to UK public health from climate change overseas | Out |
| ID10 | Systemic risk arising from the amplification of named risks cascading across sectors and borders | Out |