Processing times for planning applications are currently running with a 5/7 working day delay before we can start validating new applications. To focus resources on validation, we will not be responding to any requests for progress updates until we have had the application for 7 working days. We’re doing our best to process applications as fast as possible, and we appreciate your patience.
1. Introduction
1.1
This report presents the annual review of the council’s Strategic Housing Land Availability Assessment (SHLAA) for 2024 to 2025. It sets out the city’s housing land supply, housing trajectory and 5 year housing land supply position.
1.2
The purpose of the SHLAA is to identify a future supply of land which is suitable, available and achievable for housing over the local plan period.
This involves identifying all sites with:
- housing potential
- assessing their potential for delivery taking account of identified constraints, availability and viability
- determining the likely amount of housing and timescale for development
The SHLAA is an important part of the evidence base to inform the preparation of the City Plan 2041, but inclusion in it does not provide a judgement on whether a site should be allocated for housing development.
1.3
A key output of the SHLAA is the preparation of an indicative trajectory setting out the potential future housing supply. The NPPF states that planning policies should identify a supply of:
a) specific deliverable sites for years 1 to 5 of the plan period; and
b) specific developable sites or broad locations for growth for years 6 to 10 and, where possible, for years 11 and beyond
1.4
The NPPF sets a requirement that local planning authorities should identify and update annually a supply of specific deliverable sites sufficient to provide a minimum of 5 years’ worth of housing against their housing requirement set out in adopted strategic policies. Where the strategic policies are more than 5 years old, local housing need should be calculated using the standard method as set out in national guidance.
Where there has been significant under-delivery of housing over the previous 3 years, a 20% buffer should be included to improve the prospect of achieving the planned supply. Significant under-delivery is considered to be housing delivery below 85% of the housing requirement, as measured by the Housing Delivery Test. The NPPF indicates that past delivery will be measured through the Housing Delivery Test (which is discussed in further detail in Section 5 of this report).
Further information on the approach that should be taken to assessing housing supply and delivery is provided in Planning Practice Guidance (PPG).
1.5
The council’s approach set out in this SHLAA meets the NPPF requirements and is set out in this document.
2. The 2025 SHLAA assessment
2.1
The 2025 SHLAA has taken account of the latest information on housing land supply in the city. The information included is set out below.
a) Annual monitoring of housing development with planning permission
- i) Sites gaining planning consent for housing in the year from 1 April 2024 to 31 March 2025, including both newly identified sites and sites previously identified in the SHLAA which did not previously have planning consent.
- ii) Updated progress on previously identified sites with planning consent recording whether development on the site has yet to commence, is under construction or has been completed.
- iii) The type of residential development (whether new build, change of use or conversion); and
- iv) The adjusted supply position where sites have been developed and completed.
b) Sites without planning permission that have identified housing potential
- i) Sites without planning permission that are allocated for housing in the City Plan, or have been assessed as suitable, available and achievable for housing. This includes sites that have been promoted through the council’s pre-application advice service or have been submitted for consideration by landowners, agents and/or developers and sites in response to a ‘Call for Sites’ (for example, as part of the update for the Brownfield Land Register, or the City Plan 2041 Key Issues consultation). The SHLAA includes all sites allocated for housing in City Plan Part One (adopted March 2016) and City Plan Part Two (adopted October 2022)5 .
Assessment of site availability, capacity, and timescales
2.2
The availability, capacity and delivery timescale for all identified sites of 6 or more dwellings (net gain) has been reviewed to take account of any further information received from landowners, agents and/or developers. On sites with planning permission which have not commenced or where development has stalled, the relevant developers/agents have been contacted by the council requesting updated information.
2.3
Consideration of the availability of sites has taken into account whether existing uses are safeguarded through current City Plan policies. Sites where residential development would conflict with adopted policies have not been included. The forthcoming new City Plan 2041 will review existing safeguarded areas. Housing capacity of sites takes account of existing planning policy relating to, minimum densities and any assessment work undertaken by council officers, as well as planning applications and permissions granted, and site details submitted for a ‘Call for Sites’ or Brownfield Land Register. The potential delivery timescales and rates of housing delivery have also been informed by analysis of historic delivery rates for residential developments completed over the past decade.
Assessment of implementation rates and discounting
2.4
The assumptions relating to implementation rates for developments not yet started on small sites with planning permission (<6 units net gain) and large sites with Prior Approval for permitted development (+6 units net gain) were reviewed as part of the SHLAA update in 2022 (as set out in Paragraphs 2.2 and 2.3, all large, identified sites (6+ units net gain) with planning permission or otherwise identified in the SHLAA have been assessed on an individual site by site basis and therefore no further discounting has been applied to these sites).
This review considered past implementation rates for those types of permission in order to provide updated evidence to underpin assumptions about implementation rates and levels of discounting that should be applied.
2.5
For developments on small sites overall implementation rates were calculated to be around 70 percent and therefore the non-implementation discount for small sites is set at 30 percent. The analysis has also informed the expected development lead times for the identified supply of small sites. For large sites with Prior Approval, the implementation rate was as also calculated to be around 70 percent, so a 30 percent non-implementation discount has again been applied.
Student and other communal accommodation
2.6
The HDT allows for development of student accommodation and other communal accommodation to be counted towards the overall housing supply figure. Communal accommodation is accounted for by applying nationally set ratios based on 2021 Census data. The ratio applied for student accommodation is 2.4 student bedspaces equivalent to one dwelling, whilst for other communal accommodation, a ratio of 1.9 bedspaces equivalent to one dwelling is applied. This is based on the amount of accommodation that new student housing releases back to the wider housing market and the extent to which it allows general housing to remain in such use. As a result, sites that have gained planning consent for student and other communal accommodation (such as co-living), have been included within the housing assessment.
3. 2025 SHLAA update results
3.1
Summary Tables 1 to 7 set out the results of the 2025 SHLAA. In overall terms, the SHLAA has identified a total housing land supply of around 13,771 housing units which are projected to be deliverable up to 2041.
Large identified sites (6+ units net gain)
3.2
Summary Tables 1 and 2 indicate the potential supply from sites of 6 units and above. Up to 2041, there is an identified supply of 8,053 units within the 8 City Plan Development Areas (DA1 to DA8) (Table A ) and a further 2,983 units are across the rest of the city (Table B). The overall supply from sites of 6+ units therefore is 11,036 units.
Small Identified Sites (<6 units net gain)
3.3
Summary Table 3 sets out the supply expected from small identified sites, which includes small sites already completed and those with current planning permission. The total identified supply from small sites is 400 units, comprising 131 units completed in the period 2024 to 2025 and a further 269 units expected to be delivered on small sites with planning permission on 1 April 2025. This includes 129 units on sites which have commenced (already under construction) and 140 units on sites not yet started where a 30% discount for non-implementation has been assumed (Table C11). As shown in Table C, housing delivery from the small identified sites have been assumed to take place over Years 1 to 4 (2025/2026 to 2028/2029), with sites already commenced divided between Years 1 and 2, and sites where development has not yet started phased across Years 1 to 4. Other Sources of Housing Supply
3.4
Summary Table 4 indicates the potential additional housing supply from further sources, including Prior Approvals for change of use to residential under permitted development rights.
3.5
The SHLAA Update 2025 identifies a total of 118 net residential units with Prior Approval for change of use to residential (Class C3) under permitted development rights (meaning, without the need to apply for planning permission). To account for potential non-implementation, a 30% discount has been applied to this figure, giving a revised estimate of 83 additional residential units expected to be delivered from this source (Table D).
Small Site Windfall Allowance (less than 6 net units)
3.6
Table 6 identifies the supply estimated to come from small unidentified sites of less than 6 net units (‘small windfall sites’) over the next 15 years. The NPPF allows for windfall sites to be included as part of projected housing figures where there is compelling evidence that they will provide a reliable source of supply. It states that such allowance should be realistic having regard to the strategic housing land availability assessment, historic windfall delivery rates and expected future trends.
3.7
Table F illustrates how the windfall allowance has been calculated for small sites. The estimated windfall supply is based on average delivery on small sites of less than 6 net units over the past 5 years.
Over the period 2020/2021 to 2024/2025, there was an average annual delivery of 155 units per year on small sites.
For comparison, the average delivery over the past 10 years (2015/2016 to 2024/2025) was 156 units per year.
These figures indicate that small sites have consistently provided an important component of the city’s housing supply, and this supply shows no sign of decreasing. The analysis shows that a large majority of small windfall development takes place through conversions and changes of use (62%). It is difficult to anticipate where these types of developments are likely to arise and therefore small site development are not identified on a site-by-site basis. For these reasons, the inclusion of a windfall allowance for small sites is appropriate.
3.8
To avoid double counting with small sites which already have planning permission (those included in Table C), allowance for small site windfall has only been included in the housing supply from year 3 (2027 to 2028) onwards. As shown in Table F, it is assumed the small site completions in years 1 and 2 will comprise sites which already have planning permission (commenced and not yet started) and that completions in years 3 and 4 will include a mix of both existing small site permissions (not yet started) and windfall sites not yet identified. From year 5 (2029 to 2030) onwards, an annual small site windfall allowance of 155 units per year has been included in the housing supply figures.
4. Housing Trajectory
4.1
Chart A (shown in 6.7) presents an expected housing trajectory based on the sources of housing supply listed. The housing trajectory shows the most recent net housing completions in 2024 to 2025, and the projected annual housing delivery over the next 16 years up to 2041.
5. Five year housing land supply 2025 to 2030
5.1
The 2025 SHLAA Update has been used to update the 5 year housing land supply position. For the 5 years immediately following adoption of the City Plan Part One in March 2016, the calculation of 5 year housing supply was based on the Phased Requirement Method which is set out in the City Plan Part One Housing Implementation Strategy.
This approach was endorsed by the City Plan Part One examination inspector when finding the Plan sound in February 2016.
5.2
However, on 24 March 2021 the City Plan Part One reached 5 years since adoption. National planning policy states that where strategic policies are more than 5 years old, local housing need calculated using the government’s standard method should be used in place of the local plan housing requirement. The local housing need requirement calculated using the standard method is 2,487 homes per year.
5.3
The NPPF requires the 5 year supply calculation to include a 20% buffer where delivery has fallen below 85% of the housing requirement over the previous 3 years as measured by the Housing Delivery Test. The most recent published Housing Delivery Test figures for the period 2020 to 2023 show a housing delivery figure of 84% for Brighton & Hove which means a 20% buffer is added to the 5 year housing land requirement to produce a requirement of 14,922 residential units over the period 2025 to 2030.
5.4
The current 5 year housing land supply position is summarised in Table G. There is a potential housing supply of 4,480 residential units over the period 2025 to 2030. The sources of supply that make up this figure are set out in Summary Tables 1 to 7, whilst Tables A and B show the projected delivery and phasing of individual sites of 6+ units that fall within the first 5 years.
5.5
Table G calculates the projected 5 year housing supply (4,480 units) with the 5 year housing requirement (14,922 units) indicates an overall 5 year housing shortfall of 10,442 residential units (equivalent to 1.5 years housing supply).
Five year housing supply requirement
- Five year requirement 2025/2026 to 2029 to 2030 (based on 2,487 dpa): 12,490 residential units
- Five year requirement with 20% buffer 2025 to 2030: 14,922 residential units
- Annualised requirement: 2,984 residential units
- Deliverable housing supply 2025 to 2030
- supply identified in 2025 SHLAA: 4,086 residential units
- other windfall sources: 397 residential units
- Total supply: 4,480 residential units
- Surplus/shortfall against requirement: -10,442 residential units (1.5 years supply)
6. 2025 SHLAA update data tables
6.1 Housing supply summary tables
Summary Tables 1 to 7 set out the results of the 2025 SHLAA and provide a summary of the calculations in Tables A to F.
In overall terms, the SHLAA has identified a total housing land supply of 13,771 units which are projected to be deliverable up to 2041.
Download Summary Tables 1 to 7.
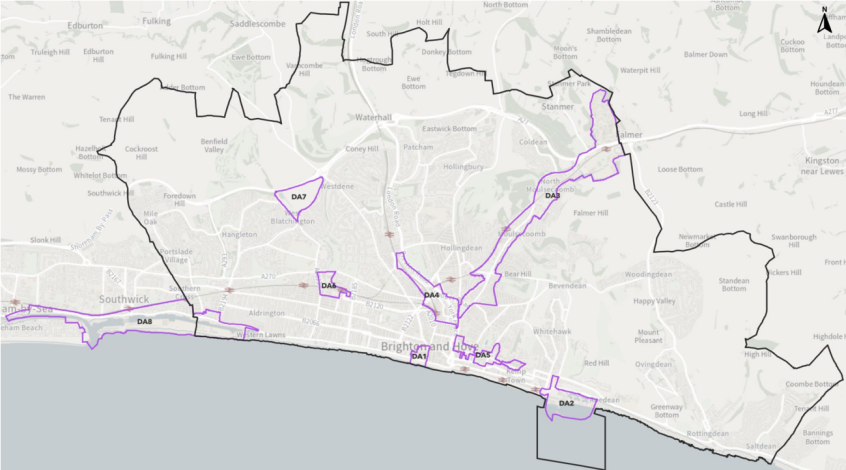
6.2 Table A: Identified housing supply (6+ units) in City Plan development areas (DAs)
The potential supply from sites of 6 units and above within the 8 City Plan Development Areas (DA1 to DA8). Up to 2041, there is an identified supply of 8,053 units within these areas.
6.3 Table B: Identified housing supply (6+ units) outside City Plan development areas
The potential supply from sites of 6 units and above across the rest of the city (outside the City Plan development areas).
Up to 2041, there is an identified supply of 2,983 units across the rest of the city.
6.4 Table C: Small identified sites (<6 units net)
Sets out the supply expected from small identified sites, which includes small sites already completed and those with current planning permission. The total identified supply from small sites is 400 units, comprising 131 units completed in the period 2024 to 2025 and a further 269 units expected to be delivered on small sites with planning permission at 1 April 2025. This includes 129 units on sites which have commenced (already under construction) and 140 units on sites not yet started where a 30% discount for non-implementation has been assumed.
As shown in Table C, housing delivery from the small identified sites has been assumed to take place over years 1 to 4 (2025/2026 to 2028/2029), with sites already commenced divided between Years 1 and 2, and sites where development has not yet started phased across years 1 to 4.
a) Small identified sites as at 1 April 2025
| 2024 to 2025 planning monitoring data | Total units | Adjusted units* |
|---|---|---|
| Small commenced (including prior approval) | 129 | 129 |
| Small not started (including prior approval) | 200 | 140 |
| Projected delivery from identified small sites | 269 |
*30% non-implementation discount applied to small not started sites.
b) Projected phasing of completions on small identified sites
| Expected distribution of identified supply | Small sites commenced | Small sites not started | Total |
|---|---|---|---|
| 2025 to 2026 (year 1) | 90 | 20 | 110 |
| 2026 to 2027 (year 2) | 39 | 50 | 89 |
| 2027 to 2028 (year 3) | N/A | 50 | 50 |
| 2028 to 2029 (year 4) | N/A | 20 | 20 |
| 2029 to 2030 (year 5) | N/A | N/A | 0 |
| Total 2025 to 2030 (years 1 to 5) | 129 | 140 | 269 |
6.5 Table D: Prior approvals for conversion to residential
Indicates the potential additional housing supply from sites with Prior Approval for change of use to 6 or more residential units (Class C3) under permitted development rights (meaning without the need to apply for planning permission). A total of 118 potential net residential units is identified. To account for potential non-implementation, a 30% discount has been applied to this figure, giving a revised estimate of 83 additional residential units expected to be delivered from this source.
a) Calculation of supply from prior approvals (> 6 Units)
| Prior approvals | Net units |
|---|---|
| Large not started prior approval | 118 |
| Total with 30% discount* | 83 |
* Assumes 70% implementation rate
b) Outstanding prior approvals of 6+ units
| Ref | Site | Units | Planning status | TE notes | |
|---|---|---|---|---|---|
| 6009 | Blocks E and F Kingsmere, London Road | 18 | Not started 2024 to 2025 | BH2024/01449 Not started 2024 to 2025. BH2021/02263 Superseded. | |
| 6018 | Blocks A and B, Kingsmere, London Road | 18 | Not started 2024 to 2025 | BH2024/01446 Not Started 2024/25. BH2021/02278 Superseded. | |
| 6212 | Block C, 101 to 120 Kingsmere Road, London Road, Brighton | 9 | Not started 2024 to 2025 | BH2024/01447 Not Started 2024/25. BH2021/02264 Superseded. | |
| 6213 | Block D, 81 to 100 Kingsmere, London Road, Brighton | 9 | Not started 2024 to 2025 | BH2024/01448 Not Started 2024/25. BH2020/02186 Superceded. | |
| 6237 | 2 Bartholomews, Brighton | 9 | Not started 2024 to 2025 | BH2022/02478 Not Started 2024/25 | |
| 6239 | 141 Davigdor Road, Hove | 18 | Not started 2024 to 2025 | BH2022/01332 Not Started 2024/25 | |
| 6001 | Boundary House Boundary Road, Hove | 18 | Not started 2024 to 2025 | BH2023/02640 Not Started 2024/25 | |
| 7033 | Mayfield Court, Lustrells Vale, Saltdean | 9 | Not started 2024 to 2025 | BH2023/01429 Not Started 2024/25 | |
| 7034 | Homeleigh, London Road, Patcham | 10 | Not started 2024 to 2025 | BH2024/00412 Not Started 2024/25 | |
6.6 Table F: Small Site Windfall Allowance
Identifies the supply estimated to come from small unidentified sites of less than 6 net units (‘small windfall sites’) over the next 15 years. The NPPF allows for windfall sites to be included as part of projected housing figures where there is compelling evidence that they will provide a reliable source of supply. It states that such allowance should be realistic having regard to the strategic housing land availability assessment, historic windfall delivery rates and expected future trends.
Table F illustrates how the windfall allowance has been calculated for small sites.
a) Net completions on small sites (<6 units) 2010 to 2025
| Monitoring year | New build | Conversions | Change of use | Conversions and changes of use | Total |
|---|---|---|---|---|---|
| 2010 to 2011 | 41 | 67 | 40 | 107 | 148 |
| 2011 to 2012 | 70 | 43 | 52 | 95 | 165 |
| 2012 to 2013 | 45 | 40 | 27 | 67 | 112 |
| 2013 to 2014 | 28 | 30 | 38 | 68 | 96 |
| 2014 to 2015 | 44 | 19 | 78 | 97 | 141 |
| 2015 to 2016 | 88 | 27 | 77 | 104 | 192 |
| 2016 to 2017 | 37 | 28 | 76 | 104 | 141 |
| 2017 to 2018 | 77 | 30 | 51 | 81 | 158 |
| 2018 to 2019 | 56 | 18 | 79 | 97 | 153 |
| 2019 to 2020 | 48 | 24 | 68 | 92 | 140 |
| 2020 to 2021 | 75 | 31 | 45 | 76 | 151 |
| 2021 to 2022 | 54 | 34 | 60 | 94 | 148 |
| 2022 to 2023 | 68 | 30 | 77 | 107 | 175 |
| 2023 to 2024 | 76 | 8 | 85 | 93 | 169 |
| 2024 to 2025 | 47 | 16 | 68 | 84 | 131 |
| Total | 854 | 445 | 921 | 1,366 | 2,220 |
| % | 38% | 20% | 41% | 62% | 100% |
a) Illustrates previous net completions on small sites between 2010 to 2025. The analysis shows that a large majority of small windfall development takes place through conversions and changes of use (62%). It is difficult to anticipate where these types of developments are likely to arise and therefore small site development cannot realistically be identified on a site-by-site basis as is the case for larger sites of 6+ units. For these reasons, the inclusion of a windfall allowance for small sites is considered to be supported by robust evidence.
b) Average Net Completions on Small Site
| Year | Total completions over period | Average completions per year |
| 2015/2016 to 2024/2025 (10 years) | 1,558 | 156 |
| 2020/2021 to 2024/2025 (5 years) | 774 | 155 |
b) Illustrates the average net completions on small sites over the past 5 and 10 years. The estimated windfall supply is based on average delivery over the past 5 years. Over the period 2020/2021 to 2024/2025 there was an average annual delivery of 155 units per year on small sites. The average delivery over the past ten years is included for comparison and was the same averaging 156 units per year. These figures indicate that small sites have consistently provided an important component of the city’s housing supply, and this supply shows no sign of decreasing.
c) Assumed 5 year supply from small windfall sites
| Site | 2025 to 2026 | 2026 to 2027 | 2027 to 2028 | 2028 to 2029 | 2029 to 2030 | Total 2025 to 2030 |
|---|---|---|---|---|---|---|
| Small identified sites (see Table C) | 110 | 89 | 50 | 20 | 0 | 269 |
| Small windfall allowance | 0 | 0 | 105 | 135 | 155 | 394 |
| Total supply from all small sites | 110 | 89 | 155 | 155 | 155 | 663 |
c) Illustrates the assumed 5 year supply from small windfall sites. Allowance for small site windfall has only been included in the housing supply from year 3 (2027 to 2028) onwards to avoid double counting with small sites which already have planning permission (those included in Table C). It is assumed the small site completions in years 1 and 2 will comprise sites which already have planning permission (commenced and not yet started) and that completions in years 3 and 4 will include a mix of both existing small site permissions (not yet started) and windfall sites not yet identified. From year 5 (2029 to 2030) onwards, an annual small site windfall allowance of 155 units per year has been included in the housing supply figures.
Total small sites delivery (completions + identified + windfall)
| Expected distribution of identified supply | Small sites commenced | Small sites not started | Total from identified sites | Small site windfall allowance | Total small sites - identified + windfall |
|---|---|---|---|---|---|
| Completions 2024 to 2025 | N/A | N/A | N/A | N/A | 131 |
| 2025 to 2026 (year 1) | 90 | 20 | 110 | 0 | 110 |
| 2026 to 2027 (year 2) | 39 | 50 | 89 | 0 | 89 |
| 2027 to 2028 (year 3) | N/A | 50 | 50 | 105 | 155 |
| 2028 to 2029 (year 4) | N/A | 20 | 20 | 135 | 155 |
| 2029 to 2030 (year 5) | N/A | N/A | N/A | 155 | 155 |
| 2030 to 2035 (years 6 to 10) | N/A | N/A | N/A | 774 | 774 |
| 2035 to 2041 (years 11 to 16) | N/A | N/A | N/A | 1,084 | 1,084 |
| Total 2025 to 2041 (years 1 to 16) | 129 | 140 | 269 | 2,252 | 2,652 |
Average small site completions over past 5 years = 155.
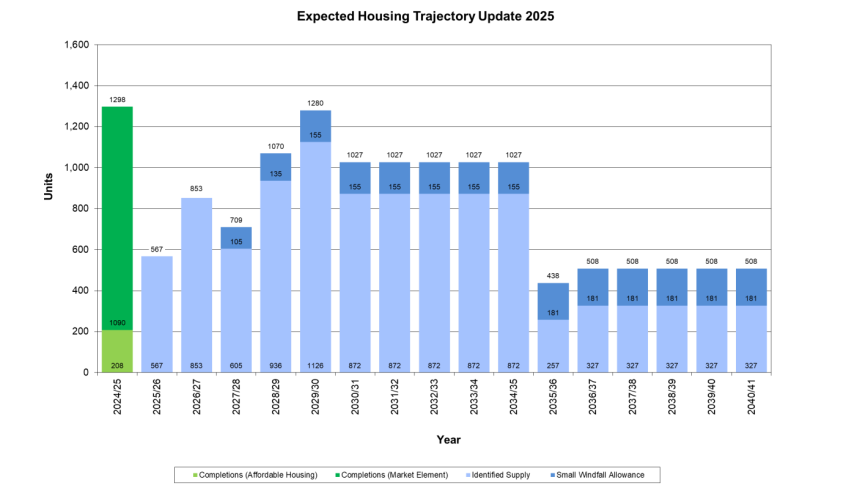
6.7 Chart A: Housing trajectory
Chart A is a graph representing a housing trajectory based on the sources of housing supply summarised in Summary Tables 1 to 7. The housing trajectory shows the annual net housing completions since the start of the City Plan period in 2010 and the projected annual housing delivery over the next 17 years up to 2041.
Appendix 1: Map showing location of City Plan development areas (DA1 to DA8)