Executive summary: air quality in our area
Brighton & Hove is committed to working with partners to ensure the city will be a place with improved health and well-being for all.
Poor air quality and inhalation of pollutants negatively impact everyone’s health, with potentially serious consequences for everyone.
Identifying problem areas and ensuring that actions are taken to improve air quality forms an important part of protecting the health and well-being of Brighton & Hove and its residents.
Improving air quality is often a complex issue, presenting a multi-agency challenge. Departments including Transport, Public Health, Safer Communities, Housing and Education must work together to deliver improvements.
The transport, heating and waste disposal choices residents and visitors make influence emissions across the city. Vehicle fleet operators have a key role in transitioning fleets to ultralow and zero emissions. Similarly housing stock will need to graduate to solutions without air emissions.
Most recent monitoring before and since COVID suggests airborne particles meet the 2005 World Health Organisation (WHO) Guidelines for annual and daily averages.
Following the Environment Act, the government has set out plans to reduce Particulate Matter in ambient air and to tackle local emissions sources. Local monitoring suggests fine particles are associated with transboundary and international emissions (from traffic, agriculture, and industry).
Higher daily levels recorded in Brighton & Hove on 1 January and 5 November are likely associated with New Year and Guy Fawkes firework events. Bonfires, fireplaces, and diesel generators contribute to short-term smoke across neighbourhoods.
Tyre and brake wear are constant sources of airborne particles where traffic slows and accelerates. Further reductions in smoke, particles and dust will benefit health at a population level.
2020 monitoring suggests Nitrogen Dioxide (NO2) continues to exceed national air quality standards adjacent to localised sections of:
- London Road and Grand Parade (A23, Air Quality Management Area AQMA1)
- Lewes Road-Elm Grove and south of Vogue Gyratory (A270 AQMA1)
- the slope of North Street (B2066 AQMA1)
NO2 levels are also close to air quality standards next to:
- Viaduct Terrace (A23, AQMA1)
- New England Road (A270, AQMA1)
- Hollingdean Road (C-Link, AQMA1)
- the haulage route South Portslade (A259-A293 AQAM3)
- the hill climbs on South Street (AQMA5)
Following the 2020 review of AQMAs a new Air Quality Action Plan (AQAP) is scheduled to follow this annual report.
Without the efforts of the air quality officer to change outdoor monitoring samples during COVID there would not be 2020 results to report here.
Eleven periods of diffusion tubes were captured during the calendar year. This included a longer period during the strictest travel restrictions from April 2020.
Acknowledgement of the Transport Research Laboratory (TRL) for providing calibrated data from Brighton & Hove’s automatic monitoring stations.
Air quality in Brighton & Hove
Air pollution is associated with a variety of adverse health impacts. It's recognised as a contributing factor in the onset of heart disease and cancer.
Additionally, air pollution particularly affects the most vulnerable in society including:
- children
- the elderly
- those with existing heart and lung conditions
Public Health England, Air Quality - A Briefing for Directors of Public Health, 2017 stated that there is also often a strong correlation with equality issues because areas with poor air quality are also often less affluent areas.
This is sourced from:
- Public Health England. Air Quality: A Briefing for Directors of Public Health, 2017
- Defra: Air quality and social deprivation in the UK: an environmental inequalities analysis, 2006
Poor-quality housing resides next to roads and junctions where pollution is relatively high. Brighton & Hove’s urban area has one of the highest population densities in England.
Cleaner air will benefit the health of a cosmopolitan city including athletes and those recovering from illness. Better air quality is an inclusive cause that can bind diverse communities.
The mortality burden of air pollution within the UK is equivalent to 28,000 to 36,000 deaths at typical ages, with a total estimated healthcare cost to the NHS and social care of £157 million in 20174.
This is sourced from:
- Defra: Air quality appraisal: damage cost guidance, July 2020
- Public Health England: Estimation of costs to the NHS and social care due to the health impacts of air pollution: summary report, May 2018
The combined influence of particulate (Public Outcomes Framework) and gas pollutants strongly influence 175 early deaths per year across Brighton & Hove.
Air Quality Management Areas are declared for NO2 because this is the only pollutant that exceeds UK air quality standards. Action to improve air quality will need to surpass UK standards for NO2.
Whilst particles do not exceed UK standards reaching out to World Health Organisation (WHO) guidelines will be a health benefit. The mixture of pollution humans inhale is a health burden, and we should not see pollution in the gas or particle phases as separate concerns.
Some pollutants such as ground levels ozone (O3) result from chemical reactions between gases in the atmosphere in the presence of sunlight. As ozone episodes are regional reporting by the Local Authority is beyond the scope of this report on local air quality.
Tiny airborne Particulate Matter (PM2.5 less than 2.5 micrometres) travels long distances between regions for example chimney stack industries can release emissions high into the atmosphere.
Ammonia is released from agricultural activities at the beginning of the growing season. In can cause spring particulate episodes regionally. Wildfires and domestic fires contribute to airborne smoke and particles.
Due to its transboundary nature, PM2.5 is not a statutory requirement for Local Air Quality Management. This annual report aligns with the Joint Strategic Needs Assessment vii and the Public Outcomes Framework viii, which include health sections on airborne PM2.5.
Across Europe, gas emissions from combustion (traffic and industry) contribute to nitrate particles in the air.
Actions to improve air quality
Whilst air quality has improved significantly in recent decades, there are some areas where local action is needed to improve air quality further.
Partly due to travel restriction 2020 was proven to be the best year for air quality in a monitoring sequence since the 1995 Environment Act. That said in many places the better annual average was due to a cleaner second quarter (April to June 2020).
During the second half of the year traffic emissions increased as the travel restrictions eased. For the second six months NO2 levels were not very different to the second half of 2019 (also better than 2017/18). A drop in NO2 was recorded November during lockdown.
There were fewer days with moderate of high particulate concentrations during 2020 compared to previous years. An ozone episode was documented in spring 2020 as winter pollutants in the atmosphere (emitted prior to travel restrictions) reacted with many sunny hours.
The lower levels of oxides of nitrogen dioxide around April 2020 were a factor with this spring ozone episode. (2020 Ozone Episode COVID-19 lockdown caused complex and harmful local air quality effects | Phlorum).
The 2019 Clean Air Strategy (Defra, Clean Air Strategy, 2019) sets out the case for action, with goals more ambitious than EU requirements to reduce exposure to harmful pollutants.
The Road to Zero (DfT, The Road to Zero: Next steps towards cleaner road transport and delivering our Industrial Strategy, July 2018) sets out the approach to reduce exhaust emissions from road transport through multiple mechanisms; this is extremely important given that the high proportion of Air Quality Management Areas (AQMAs) are designated due to elevated concentrations heavily influenced by transport emissions.
The switch of traffic from the east to the west side of Valley Gardens (A23) in September 2019 has helped deliver substantial improvements in localised air quality around Marlborough Place, Gloucester Place and York Place.
Widening of concourses and planting has created more space for pedestrians, cafés and outdoor seating in this area.
Brighton & Hove buses' inclusion of 54 georeferenced capable euro-VI emissions buses has helped reduce roadside NO2 around the Ultralow Emission Zone (ULEZ) and AQMAs. So far, this privately funded action has been phased in with two procurement steps rolled out in September 2019 and October 2020.
Defra funds in combination with the Sustainability and Carbon Reduction Investment Fund (SCRIF) and operator contributions enable older bus exhausts to be retrofitted for lower emissions. This will help reduce NOx emissions in several AQMAs across more than one Local Authority with wider benefits across Brighton & Hove, Sussex, Kent and Surrey.
Progress has been made with cycling infrastructure and cycling as a mode of transport. The Local Cycling and Walking Infrastructure Plan (LCWIP) is available for public consultation before the AQAP schedule later this year.
The use of private bicycles and bike sharing is on the increase. Since last year there have been more opportunities to use e-bikes. The rise of inclusive cycling (adults and children) as a viable transport mode for many shorter journeys can free up road space for trade and distribution.
A Defra-funded project across Sussex has enabled Sustrans to share educational messages with schools especially themes associated with active and zero-emission travel.
The avoidance of cold exhausts associated with short urban vehicle journeys can help avoid emissions. Since 2019 there has been a high increase in working from home which has saved commuter trips and freed up road space for deliveries and leisure.
The city council chairs and participates in the Sussex Air Quality Partnership, and liaises with Highways England, the South Downs National Park Authority the Environment Agency and Public Health England as required.
The 2020 Sussex Air Pollution Monitoring Report sets out the regional picture and complements this report on local air quality.
Conclusions and priorities
The AQMAs were reviewed and approved by the committee with new declarations delivered in November 2020. The AQMAs are up to date.
A revised detailed air quality assessment and a new AQAP are scheduled to follow this report. Responses to the Transport Plan (LTP) and LCWIP public consultation are being considered.
The remaining air quality standards and exceedances are all within declared AQMAs.
AQMA4 and AQMA6 have shown signs of compliance in 2019. Monitoring will continue in these locations from January 2021.
In all AQMAs, it will be important that new planning permission do not further enclose or flank roads. Opportunities should be sought to open streets and widen footways where possible.
The council has the intention to expand the Ultralow Emission Zone in combination with a liveable city centre and Low Traffic Neighbourhoods (LTNs). There is interest in having improved smoke control. There will be cost and time challenges in delivering all these ambitions around the same time. Diesel vehicles will need to move on from the euro-5 (light vehicles) and euro-V (heavy vehicles) emission standards as a matter of urgency.
Since last year’s annual report on air quality, the city has convened senior and junior public Climate Assemblies setting out measures to work toward climate neutrality by 2030. It includes accelerating the road to zero emissions for transport and buildings.
The areas of NO2 exceedance are more localised than before. This provides an opportunity for targeted monitoring, intervention, and mitigation supported by planning policy.
Different solutions are required for various transport corridors that have varying proportions of cars, vans, motorbikes, lorries, and buses.
Arterial routes meet around the City Centre and are joined together in AQMA1. Smaller outlying AQMAs are due to road traffic emissions in a confined space or motorised emissions on a hill climb. There is a risk of gas emissions from the energy centre at the hospital contributing to upper levels and AQMA6.
Health damage costs of development(s) are most likely to be significant where additional road traffic emissions are added to the AQMAs.
Local engagement and how to get involved
Everyone can do a little bit to help improve local air quality. For example, the travel and heating choices they make.
Healthy Travel Choice hierarchy
- Active Travel – walking, cycling and roller booting
- Battery assisted bicycles
- Public Transport
- Electric car or van
- Battery vehicle with a range extender
- Petrol‐electric hybrid
- Small Petrol engine
- Diesel Hybrid
- Diesel with effective exhaust mitigation
- Diesel without exhaust mitigation
Healthy heating and cooling hierarchy
- Renewable generated electricity without combustion with passive house and energy storage
- Electric grid or microgeneration without emissions
- Biogas Fired Boilers (Ultralow NOx)
- Natural Gas Fired Boilers (Ultralow NOx)
- Combined Heat and Power (NOx)
- Pellet Stoves (low PM & NOx)
- Log Burning
- Diesel Generators
- Heavy fuel oil
- Coal
1. Local air quality management
This report provides an overview of air quality in Brighton and Hove City up to and including 2020. It fulfils the requirements of Local Air Quality Management (LAQM) as set out in Part IV of the Environment Act (1995) and the relevant Policy and Technical Guidance documents.
The LAQM process places an obligation on all local authorities to:
- regularly review and assess air quality in their areas
- determine if the air quality standards (formerly objectives) are likely to be achieved
Where an exceedance is considered likely the local authority must declare an Air Quality Management Area (AQMA) and prepare an Air Quality Action Plan (AQAP) setting out the measures it intends to put in place in pursuit of compliance with national standards for air quality.
This Annual Status Report (ASR) is an annual requirement showing the strategies employed by Brighton and Hove City to improve air quality and any progress that has been made.
2. Actions to improve air quality
2.1 Air Quality Management Areas
Air Quality Management Areas (AQMAs) are declared when there is an exceedance or likely exceedance of an air quality standard.
After declaration, the authority should prepare an Air Quality Action Plan (AQAP) within 12 months setting out measures it intends to put in place in pursuit of compliance with the standards.
A summary of AQMAs declared by Brighton & Hove can be found in Table 2.1. The table presents a description of the 6 designated AQMAs (2020) currently designated for nitrogen dioxide within Brighton & Hove.
Appendix D: Map(s) of Monitoring Locations and AQMAs. The air quality standards pertinent to the current AQMA designation(s) are as follows:
- NO2 annual mean all AQMAs
- AQMA1 + AQMA6 NO2 annual mean and hourly means
Table 2.1 Declared Air Quality Management Areas
For parts of the A23 and A270 transport corridors, the first AQMA in Brighton & Hove was declared in 2004.
The concentration (level) of NO2 at declaration (hourly or annual exposure setting) refers to 2013 the previous time the AQMAs were reviewed across the city.
The current year refers to 2020 which is the last full calendar year which of course had periods of travel restrictions.
From late March to June, motorised traffic emissions were a fraction of normal levels. Results for AQMA4 & AQMA6 are based on 2019 monitoring before the AQMA declarations. The monitoring stopped at these locations during 2020 and resumed in 2021.
2.2 Progress and impact of measures to address air quality in Brighton & Hove
The Annual Status Report is independently appraised by the Department for Environment (DEFRA) and includes:
- acknowledgement of 6 AQAM declared November 2020
- a downward trend in NO2 across the city
- 54 NO2 diffusion tube monitors with recorded exceedances down from 32 in 2018 to 17 in 2019 to 5 in 2020
- there were no air quality standard exceedances outside of NO2 AQMAs
- quality assurance and quality control QA/QC procedures for air quality monitoring have been applied and are included again in this report
- the report contained a discussion of the Public Outcomes Framework indicator and measures to reduce PM2.5 emissions
- the council has provided a very good discussion on pollutant trends with distinction on locations and this approach is encouraged for future reports
- an extensive list of measures to actively engage with air quality improvement
- It is extremely helpful that the report highlights which AQMA diffusion tubes are located
- a reference of where the concentrations in Table 2.1 are recorded is included in the report
- the impacts, opportunities and challenges brought by COVID-19 have been identified and detailed
- on the basis of the evidence provided by the Local Authority, the conclusions reached are accepted by DEFRA
The council plans to update its Air Quality Action focusing on 6 AQMAs and progress to public consultation 2021/22.
Following consultation, the most likely schedule for an AQAP report to the Environment, Transport and Sustainability (ETS) Committee is mid-2022.
Brighton & Hove has taken forward several direct measures during the current reporting year of 2020 in pursuit of improving local air quality. Details of all measures completed, in progress or planned are set out in Table 2.2.
Measures are included within Table 2.2, with the type of measure and the progress Brighton & Hove have made during the reporting year of 2020 presented. Where there have been, or continue to be, barriers restricting the implementation of the measure, these are also presented in Table 2.2.
More detail on these and new measures will be set out in a new Air Quality Action Plan scheduled straight after this report.
Feedback from the Local Transport Plan (LTP5) and Local Cycling and Walking Infrastructure Plan (LCWIP) is currently being processed. Key completed measures are:
- roll out of cleaner buses
- promotion of active travel
- introduction of cargo bikes and e-bikes
- rapid and fast electromotive charging facilities on the street, in communal car parks and for taxis
- a low-interest loan to take forward a zero-emission council fleet
- plans for marine and air source heat pumps avoiding local combustion and emission to air
- increased roof coverage with solar panels
Brighton & Hove expects the following measures to be completed over the next reporting year:
- retrofit of intermediate-age euro-V buses
- retirement of older buses
- further exploration of hydrogen fuel for heavy vehicles
- seek opportunities to offset buildings and open streets in the AQMAs to improve ventilation of the outdoor and indoor interface
Brighton & Hove’s priorities for the coming year are active travel and further development of ultralow emission zones in combination with low-traffic neighbourhoods.
The principal challenges and barriers to implementation that Brighton & Hove anticipates facing are officer time and availability of funds to deliver the measures identified.
Progress on the following measures has been slower than expected due to access to council computer networks and hardware and Covid travel restrictions.
Whilst the measures stated above and in Table 2.2 will help to contribute towards compliance, Brighton & Hove anticipates that further additional measures not yet prescribed will be required in subsequent years to achieve compliance and enable the revocation of AQMAs one to 6.
Updates will be provided in the new AQAP.
Table 2.2 Progress on measures to improve air quality
2.3 PM2.5 – Local Authority Approach to Reducing Emissions and/or Concentrations
As detailed in Policy Guidance LAQM.PG16 (Chapter 7), local authorities are expected to work towards reducing emissions and/or concentrations of PM2.5 (particulate matter with an aerodynamic diameter of 2.5µm or less). There is clear evidence that PM2.5 has a significant impact on human health, including premature mortality, allergic reactions, and cardiovascular diseases.
Whilst the tiny airborne particles are not defined by composition or toxicology, when inhaled they can be drawn deep into the respiratory tract, crossing over into the bloodstream.
PM2.5 is referred to in section 6.49 of the Joint Strategic Needs Assessment (JSNA) and is linked with the Public Health Outcomes Framework (PHOF). PHOF sets out a vision for public health “to protect the nation's health and improve the health of the poorest fastest”.
Brighton & Hove is taking the following measures to address PM2.5:
- the phasing out of pre-euro-V emission buses reduces particulate emissions from the frequent bus fleet. Council, taxi and haulage fleets have also made progress in phasing our pre-euro 5 vehicles
- the phasing out of pre-euro-VI emission standards will further reduce nitrates that are precursors to the formation of particles in the atmosphere
- the Council is in talks with the University of London regarding improving true wheel alignment to reduce tyre wear and particulate release into the air
- Construction Environment Management Plans have progressively more stringent emissions standards for Non-Road Mobile Machinery including bulldozers, dumpers, and cranes
- static diesel generators are discouraged for works and events, especially those that are likely to last more than a few days
- members have requested that officers consider the declaration of a citywide Smoke Control Area (SCA). The new Environment Act sets out stronger powers for Local Authorities
- in the interests of communal health, the council issued a series of public statements discouraging indoor and outdoor domestic burning during the COVID-19 pandemic
- to complement Defra’s automatic urban-rural monitoring network (site at Preston Park) the City Council monitors for PM2.5 adjacent to Lewes Road and North Street. During 2020 the data capture of council monitors surpassed Defra’s monitoring station in Preston Park
- Brighton & Hove is exploring options for further PM2.5 monitoring in the city to deliver a quality-assured, consistent and reliable network tied with monitoring across Sussex
Further guidance is available under the PM2.5 and Action Planning section of Technical Guidance LAQM.TG16 (Chapter 2).
There were no 24-hour periods during 2020 with moderate levels of PM2.5 or concentrations more than the 2005 WHO daily recommended level. Further details are given in Table A8.
The September 2021 WHO recommendations have been published since the writing of this report and will be discussed further in the following AQAP.
3. Air quality monitoring data and comparison with air quality objectives and national compliance
This section sets out the monitoring undertaken within 2020 by Brighton & Hove and how it compares with previous years and relevant air quality standards. In addition, monitoring results are presented for 5 years (tabular summaries) between 2016 and 2020 to allow monitoring trends to be identified and discussed.
Where available longer-term trends are included. As the AQMAs were recently updated there are no plans to make alternations in the next few years. Long-term results are also important for short-term objectives because these are the tally of polluted days or hours throughout the calendar year.
3.1 Summary of Monitoring Undertaken
3.1.1 Automatic Monitoring Sites
Brighton & Hove undertook automatic monitoring at two sites during 2020. This complements one Defra and one University of Brighton automatic monitoring location. Table A.1 in Appendix A shows the details of the automatic monitoring sites.
Maps showing the location of the monitoring sites are provided in Appendix D. Further details on how the monitors are calibrated and how the data has been adjusted are included in Appendix C.
3.1.2 Non-Automatic Monitoring Sites
Brighton & Hove undertook non-automatic (such as, passive) monitoring of NO2 with 56 samples at 54 separate locations over 11 periods during 2020. In most cases, this enabled sampling to be constant from 2019 through to 2021. Table A.2 in Appendix A presents the details of the non-automatic sites.
Maps showing the location of the monitoring sites are provided in Appendix D. Further details on Quality Assurance/Quality Control (QA/QC) for the diffusion tubes, including bias adjustments and annualisation, are included in Appendix C.
3.2 Individual Pollutants
The air quality monitoring results presented in this section are, where relevant, adjusted for bias, annualisation (where the annual mean data capture is below 75% and greater than 25%). Further details on adjustments are provided in Appendix C.
3.2.1 Nitrogen Dioxide (NO2)
Table A.3 and Error! Reference source not found. Appendix A compares the ratified and adjusted monitored NO2 annual mean concentrations for the past five years with the air quality standard of 40µg/m3. Note that the concentration data presented represents the concentration at the location of the monitoring site, following the application of bias adjustment and annualisation, as required. All exceedances and near misses occur within the AQMAs amended during 2020.
For diffusion tubes, the full 2020 dataset of monthly mean values is provided in Appendix B. Note that the concentration data presented in Table B.4 includes distance-corrected values, only where relevant.
Table A.4 in Appendix A compares the ratified continuously monitored NO2 hourly mean concentrations for the past five years with the air quality objective of 200µg/m3, not to exceed more than 18 hours per year. There were no recorded exceedances of the hourly standard during 2020.
For the first time, there were no NO2 annual means greater than 60µg/m3. As before the curbside monitoring adjacent to the North Street hill climb is closest to exceeding this level, but has reduced by more than 50% since its peak in 2013.
There are no plans to alter the AQMAs in the next few years. The monitoring network is adapting to monitor transport changes such as diffusion tube C01-2020 on the Old Stene and a new project to determine before during and after the western extension of the Old Shoreham Road cycle Lane, some of these new monitors (2021) are at kerbside.
3.2.2 Particulate Matter (PM10)
Since 2015 Brighton & Hove has monitored PM2.5 instead of PM10 and the relatively coarse fraction of airborne particulate complies with national standards. If funding is available the council will consider resuming monitoring both PM10 and PM2.5.
3.2.53 Particulate Matter (PM2.5)
Table A.5 in Appendix A presents the ratified and adjusted monitored PM2.5 annual mean concentrations for the past five years. 2020 PM2.5 monitoring in a variety of settings suggests levels meet the WHO guidelines for the annual and daily means.
3.4.2 Sulphur Dioxide (SO2)
Sulphur Dioxide levels have been found to comply with national standards across the Greater Brighton area. The University of Brighton monitors SO2x.
Appendix A: Monitoring results
Trends in annual mean NO2 concentrations
It's important to present trends by geographical areas defined by the AQMAs because each transport corridor has a unique mix of emission sources (bus, lorry, van, taxi, car, motorcycle and other combustion).
Monitors along the same transport corridor are effectively downstream from one another and more likely to agree or correlate. Similar results and trend patterns reinforce the available evidence collectively. We have a higher confidence in results when results are repeated over many years at more than one location.
The emission sources associated with different transport corridors will help guide the Air Quality Action Plan (AQAP).
The best value solutions and mitigation mix will vary for each arm of AQMA1 and the smaller AQMAs outside the City Centre.
Figure A.1a Diffusion Tubes AQMA1-A23 NO2 2010 to 2020
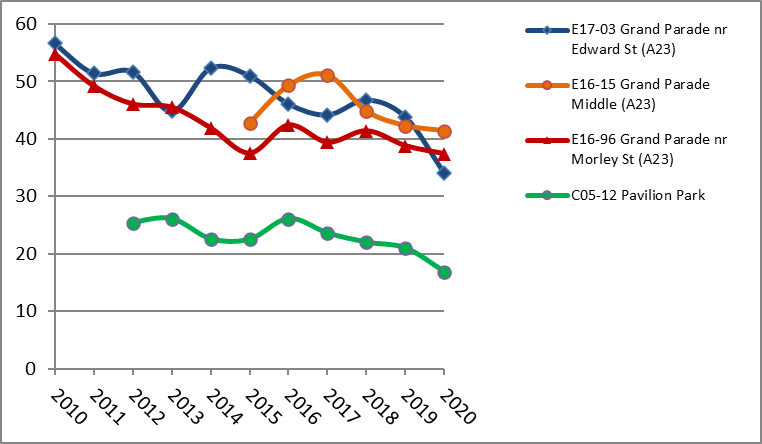
Figure A.1a presents NO2 annual mean concentrations for monitoring sites adjacent to the A23. There are exceedances of the annual mean standard in 2020 at Grand Parade and a general trend of reduction experienced across the sites.
Figure A.1b Diffusion Tubes AQMA1-A23 NO2 2010 to 2020
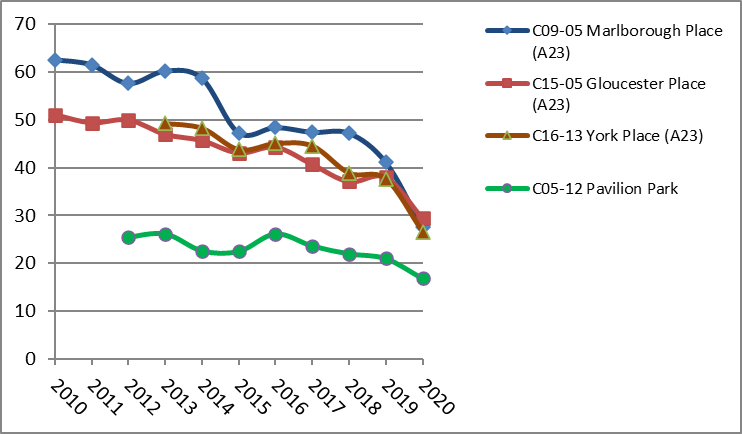
Figure A.1b presents NO2 annual mean concentrations for monitoring sites adjacent to the A23. There are exceedances of the annual mean standard in 2020 at Grand Parade and a general trend of reduction experienced across the sites.
Figure A.1c Diffusion Tubes AQMA1-A23 NO2 2010 to 2020
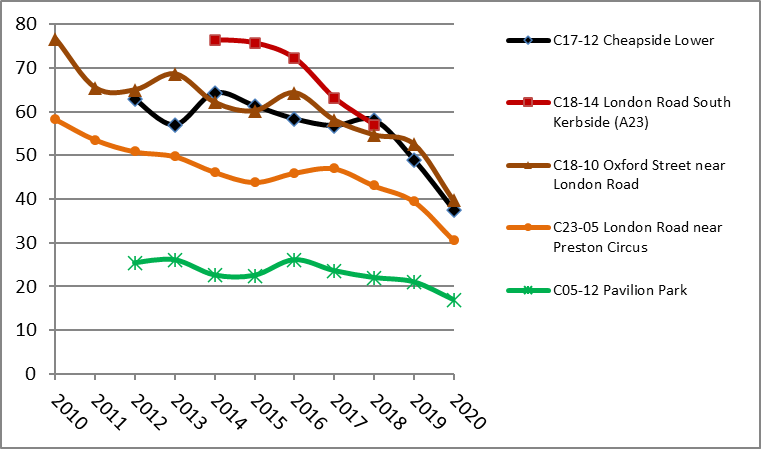
Figure A.1c presents NO2 annual mean concentrations for monitoring sites adjacent to the A23. There are exceedances of the annual mean standard in 2020 at Grand Parade and a general trend of reduction experienced across the sites.
Figure A.1d Diffusion Tubes AQMA1-A23 NO2 2010 to 2020
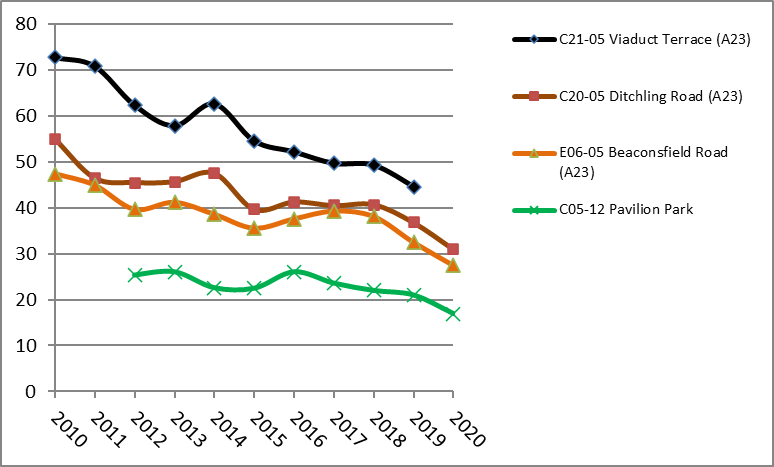
Figure A.1d presents NO2 annual mean concentrations for monitoring sites adjacent to the A23. There are exceedances of the annual mean standard in 2020 at Grand Parade and a general trend of reduction experienced across the sites.
Figure A.1e - Façade Diffusion Tubes AQMA1 ULEZ NO2 2008 to 2020
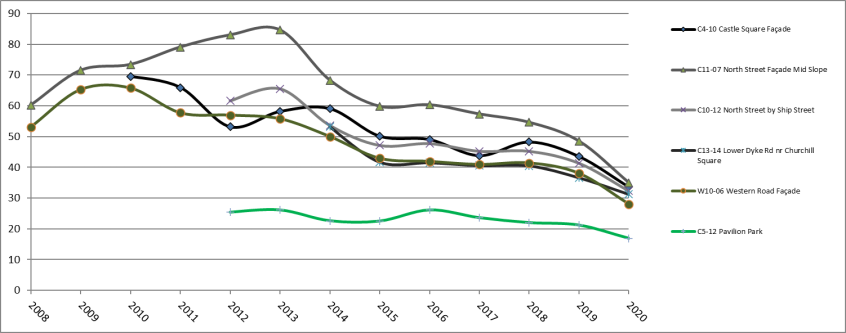
Figure A.1e presents NO2 annual mean concentrations for monitoring sites adjacent to the A23. There are exceedances of the annual mean standard in 2020 at Grand Parade and a general trend of reduction experienced across the sites.
Figure A.2 - Diffusion Tubes AQMA1 Main Railway Station Approach NO2 2010 to 2020
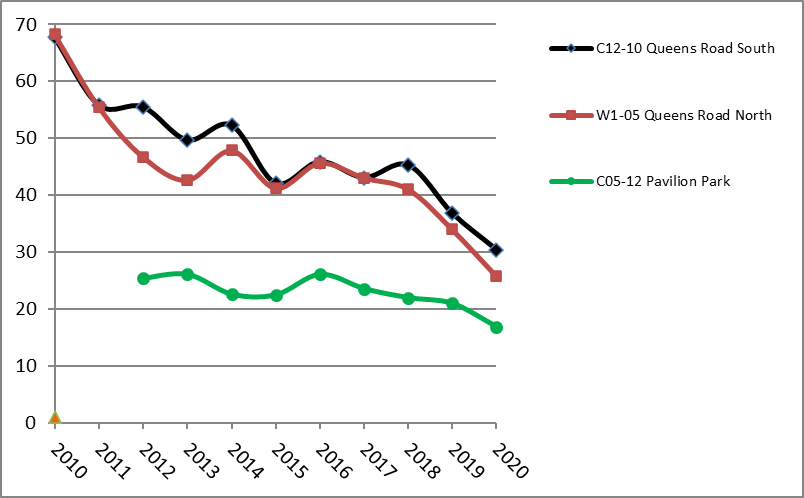
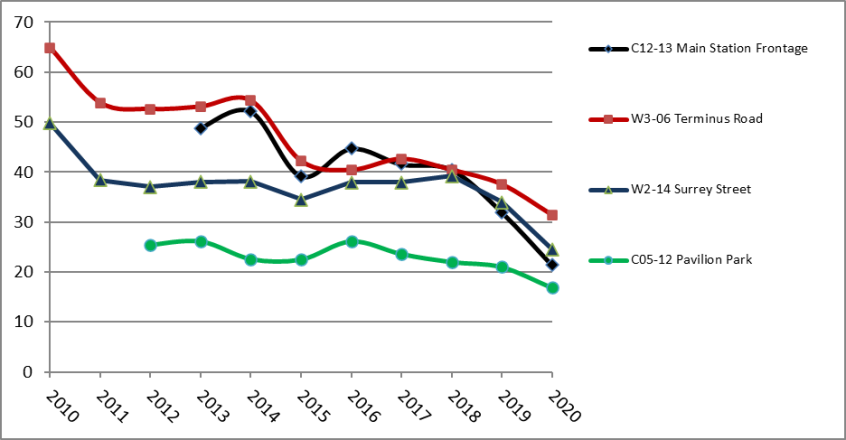
Figure A.3a - Diffusion Tubes AQMA1 New England and Lewes Road A270 NO2 2010 to 2020
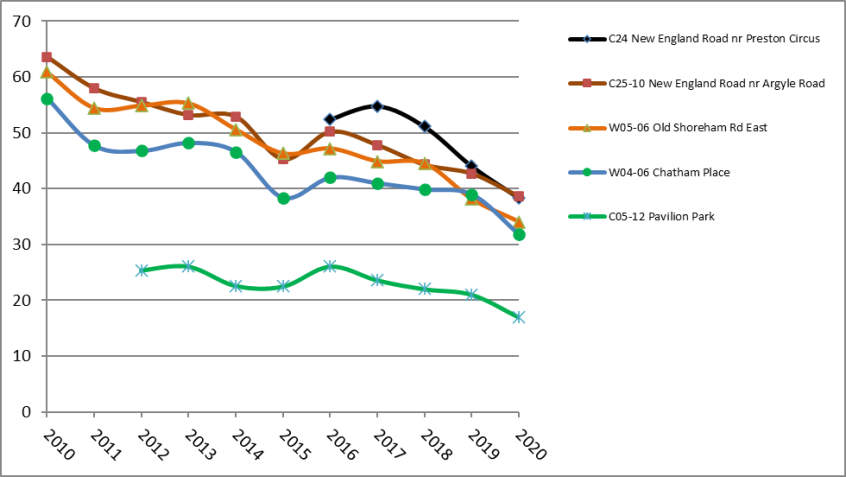
Figure A.3a presents NO2 annual mean concentrations for monitoring sites adjacent to the ULEZ. There are exceedances of the annual mean standard in 2020 on parts of North Street and a general trend of improvement recorded by monitors along the transport corridor.
Figure A.3b - Diffusion Tubes AQMA1 New England and Lewes Road A270 NO2 2010 to 2020
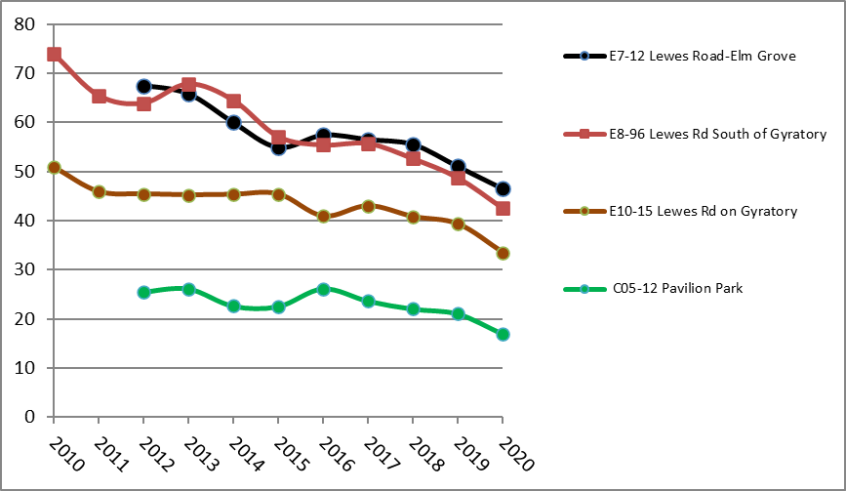
Figure A.3b presents NO2 annual mean concentrations for monitoring sites adjacent to the ULEZ. There are exceedances of the annual mean standard in 2020 on parts of North Street and a general trend of improvement recorded by monitors along the transport corridor.
Figure A.3c - Diffusion Tubes AQMA1 New England and Lewes Road A270 NO2 2010 to 2020
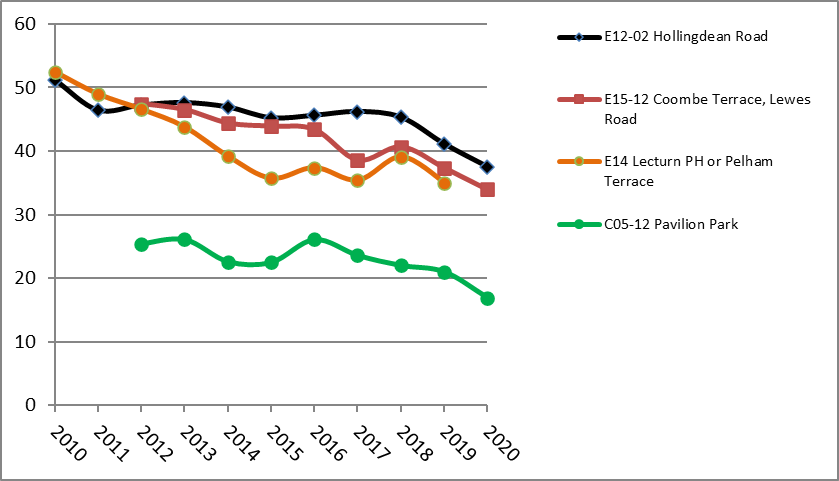
Figure A.3c presents NO2 annual mean concentrations for monitoring sites adjacent to the ULEZ. There are exceedances of the annual mean standard in 2020 on parts of North Street and a general trend of improvement recorded by monitors along the transport corridor.
Figure A.4 - Diffusion Tubes AQMA2 Rottingdean B2123 and A259
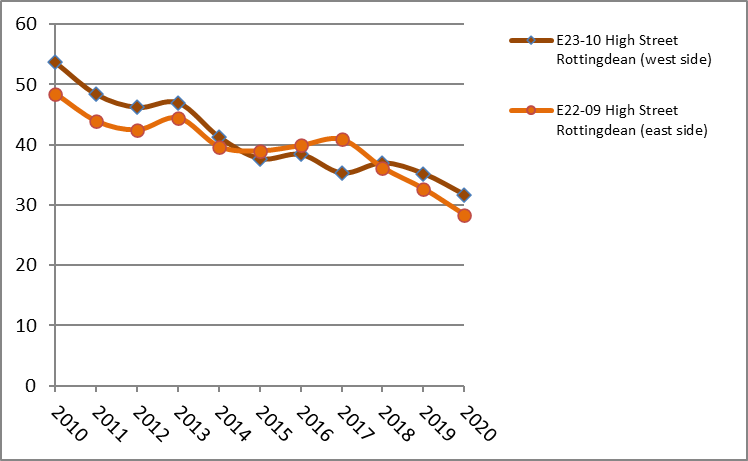
Figure A.4 presents NO2 annual mean concentrations for roadside monitoring sites on approach to the main railway station. The area complies with all national air quality standards and has shown substantial improvements in NO2 since 2018. This needs to be sustained as travel restrictions ease.
Figure A.5a - Diffusion Tubes AQMA3 South Portslade A293 and A259
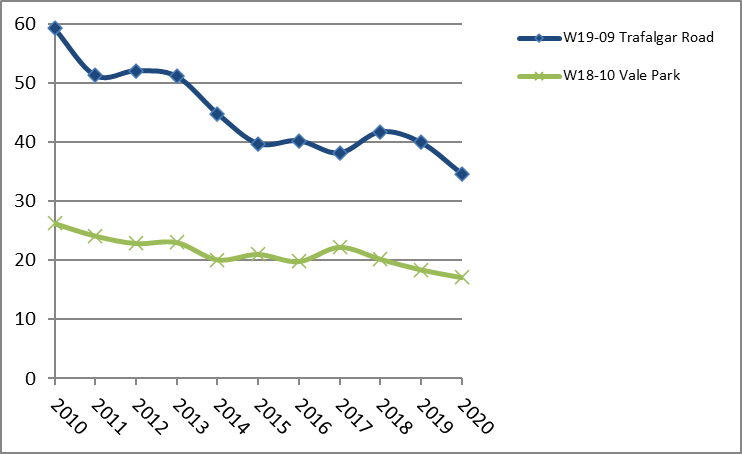
Figure A.5a presents NO2 annual mean concentrations for A270 roadside sites. There are exceedances of the annual mean standard in 2020 near Lewes Road north of Elm Grove and south of Vogue Gyratory. Levels are also close to exceeding on Hollingdean Road. There is an improvement in NO2 along the transport corridor.
Figure A.5b - Diffusion Tubes AQMA3 South Portslade A293 and A259
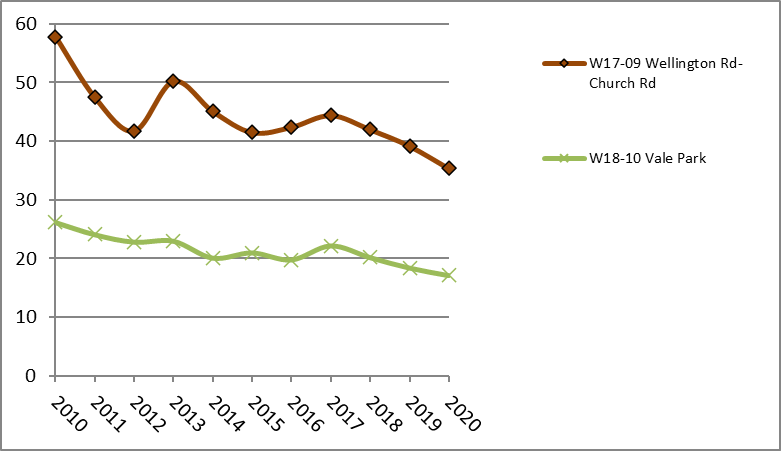
Figure A.5b presents NO2 annual mean concentrations for A270 roadside sites. There are exceedances of the annual mean standard in 2020 near Lewes Road north of Elm Grove and south of Vogue Gyratory. Levels are also close to exceeding on Hollingdean Road. There is an improvement in NO2 along the transport corridor.
Figure A.6 - Diffusion Tubes AQMA5 South Street Link to A23
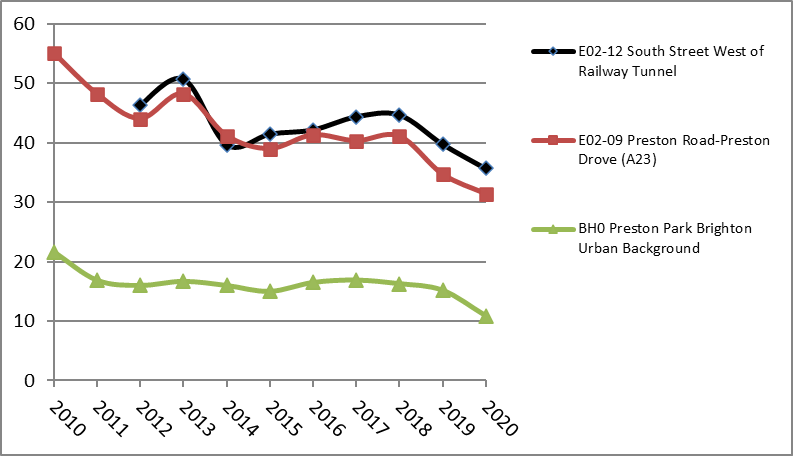
Figure A.6 presents NO2 annual mean (decade-term trends) for AQMA2. There has been a significant improvement since 2017 with evidence of compliance. Sustained improvement next to the B2123 and A259 is required to revoke the AQMA.
Table A.4 – 1-Hour Mean NO2 Monitoring Results, Number of 1-Hour Means > 200µg/m3
Notes
Results are presented as 1-hour periods where concentrations greater than 200µg/m3 have been recorded.
Exceedances of the NO2 1-hour mean objective (200µg/m3 not to be exceeded more than 18 times/year) are shown in bold.
If the period of valid data is less than 85%, the 99.8th percentile of 1-hour means is provided in brackets.
(1) Data capture for the monitoring period, in cases where monitoring was only carried out for part of the year.
(2) Data capture for the full calendar year, for example, if monitoring was carried out for 6 months, the maximum data capture for the full calendar year is 50%).
At monitoring site BH6 5 hours were recorded at > 100 µg/m3 NO2, four of these hours were during the winter: either during January or on the 2nd of March. Two were in the evening, one in the morning and two in the middle of the day. The highest hourly value recorded at BH6 in 2020 was 132 µg/m3 at 15:00 on Monday 20th January.
Site BH10 six metres from North Street near Ship Street recorded forty-nine hours > 100 µg/m3 NO2, 67% of these relatively polluted hours occurred during the winter on or before 6 March, that is before travel restrictions. 33% of the most polluted hours in the year occurred on or after 30 July during August up to 15 September when the weather was fine, travel restrictions eased, and visitor numbers increased. The highest hourly value recorded of NO2 at BH10 in 2020 was 137 µg/m3 at 6pm on Saturday 8 August.
The background Automatic Urban Rural Network (AURN BH0) Site at Preston Park had very high data capture (99.2%) for NO2 during 2020. There were no recorded exceedances of the hourly standard, the highest recorded hourly average during the year was 84 µg/m3 at 8pm on 6 March.
Figure A.7a – Trends in Number of NO2 1-Hour Means > 200µg/m3
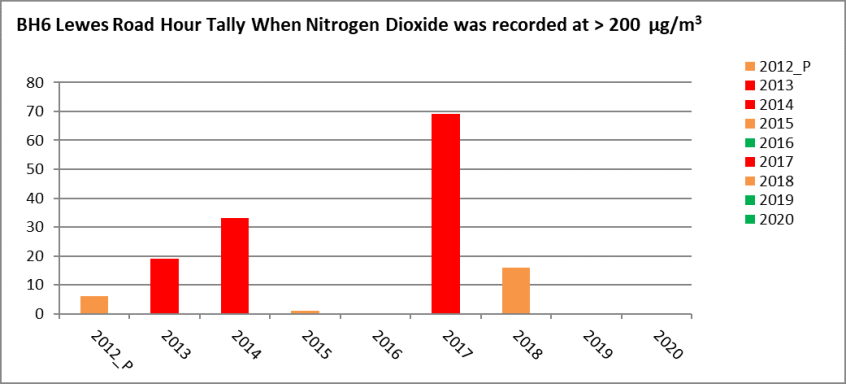
Figure A.7a presents NO2 annual mean (decade-term trends) for AQMA3. There has been a significant improvement since 2017/18. Levels are still close to exceeding national standards along the A293 and A259 road corridors.
Figure A.7b – Trends in Number of NO2 1-Hour Means > 200µg/m3
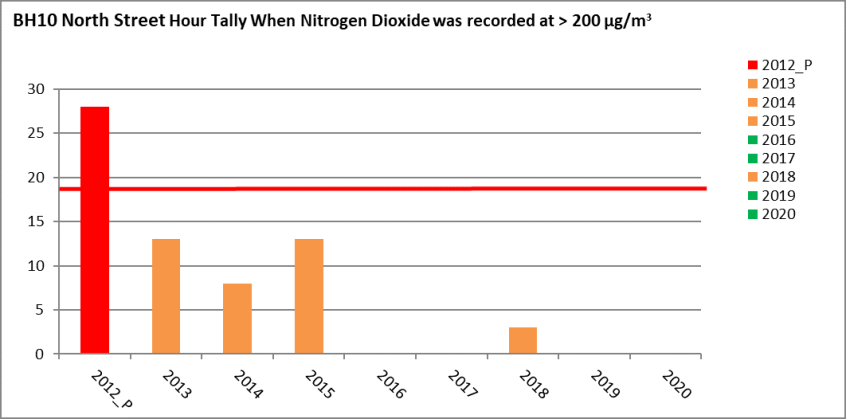
Figure A.7b presents NO2 annual mean (decade-term trends) for AQMA3. There has been a significant improvement since 2017/18. Levels are still close to exceeding national standards along the A293 and A259 roads corridors.
Table A.5 – Annual Mean PM2.5 Monitoring Results (µg/m3)
Notes
Due to intermittent data capture, PM2.5 is not reported for AURN site BH0. A BAM monitor started in 2020 replacing the previous method. Caution should be taken when comparing different monitoring methods.
The annual mean concentrations are presented as µg/m3.
All means have been “annualised” as per LAQM.TG16 if valid data capture for the full calendar year is less than 75%. See Appendix C for details.
(1) Data capture for the monitoring period, in cases where monitoring was only carried out for part of the year.
(2) Data capture for the full calendar year (e.g. if monitoring was carried out for 6 months, the maximum data capture for the full calendar year is 50%).
At site BH6 Lewes Road there were no recorded exceedance of the PM2.5 WHO daily guideline during 2020. Throughout the year results were also below the UK air quality index moderate level. The highest recorded day at the site was 24.7 µg/m3 on 5 November. The second highest day of the year measured at the site: 17.5 µg/m3 occurred on the 1 January. Both dates suggest an airborne particulate contribution from firework sources in Brighton & Hove or further afield.
At site BH10 North Street there were no recorded exceedances of the PM2.5 WHO daily guideline during 2020. Throughout the year results were below the UK air quality index moderate level. Consistent with other sites results indicate a particulate episode from 10 August peaking on 12 August with a 24-hour average of 22.2 µg/m3. 21.4 µg/m3 was recorded on 5 November and 18.5 µg/m3 on 1 January which shows strong agreement with the highest days of the year at Lewes Road suggesting regional rather than localised influences.
Figure A.8 – Trends in Annual Mean PM2.5 Concentrations
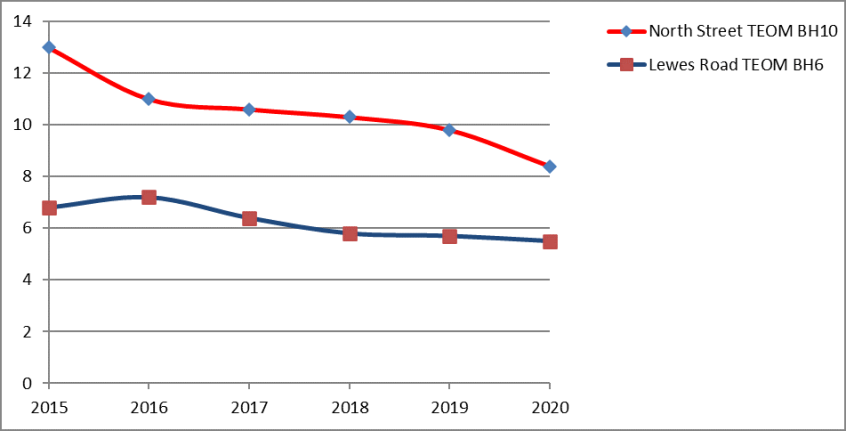
Figure A.8 presents NO2 annual mean (decade term trends) for AQMA5. There has been a significant improvement since 2018. Levels are still close to exceeding national standards next the Hill Climb on South Street.
Notes
Roadside monitors using the TEOM method.
Appendix B: Full monthly diffusion tube results for 2020
Table B.1 – NO2 2020 Diffusion Tube Results In and Around AQMA1 A23 (µg/m3)
Table B.2 – NO2 2020 Diffusion Tube Results AQMA1 Ultralow Emission Zone B2123 (µg/m3)
Table B.3 – NO2 2020 Diffusion Tube Results AQMA1 Main Railway Station Approach Including the A2010 (µg/m3)
Table B.4 – NO2 2020 Diffusion Tube Results AQMA1 New England Road and Lewes Road A270 (µg/m3)
Table B.5 – NO2 2020 Diffusion Tube Results AQMA2 Rottingdean B2123 and A259 (µg/m3)
Table B.6 – NO2 2020 Diffusion Tube Results AQMA3 South West Portslade A293 and A259 (µg/m3)
Table B.7 – NO2 2020 Diffusion Tube Results AQMA5 South Street Link Under the Railway and the Preston Road A23 (µg/m3)
All erroneous data has been removed from the NO2 diffusion tube dataset presented in Table B.1:
- annualisation has been conducted where data capture is <75% and >25% in line with LAQM.TG16
- local bias adjustment factor used
- where applicable, data has been distance corrected for relevant exposure in the final column
- Brighton & Hove confirm that all 2020 diffusion tube data has been uploaded to the Diffusion Tube Data Entry System
Notes
Exceedances of the NO2 annual mean objective of 40µg/m3 are shown in bold.
NO2 annual means exceeding 60µg/m3, indicating a potential exceedance of the NO2 1-hour mean objective are shown in bold and underlined.
See Appendix C for details on bias adjustment and annualisation.
Appendix C: Supporting technical information / air quality monitoring data QA/QC
Changed sources identified within Brighton & Hove since 2019
Around Valley Gardens II A23 traffic flow has been altered to include 2-way general traffic on the east side and buses on the west side. Additional Georeferenced buses (about one-fifth of the bus fleet) will alter what emissions in the ULEZ and other parts of the AQMAs.
These updates can be woven into the emission and dispersion model assessments before the AQAP going to the committee.
Additional air quality works undertaken by Brighton & Hove during 2020
To determine the 6 AQMAs declared in 2020 a detailed air quality assessment accompanied the report to Environment Transport and Sustainability Committee.
This was in advance of a report outlining the intention to expand the city's Ultralow Emission Zone. The report can be updated before the AQAP is considered by the ETS committee.
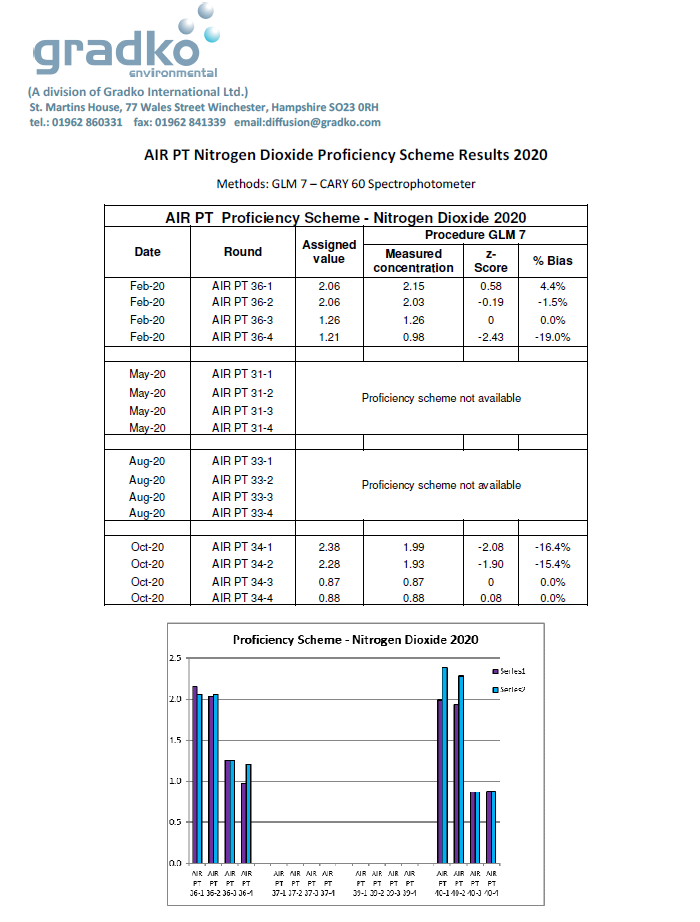
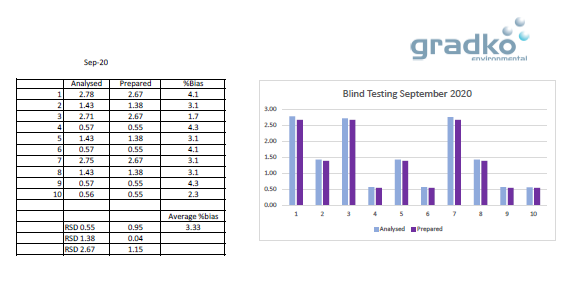
QA/QC of diffusion tube monitoring
Gradko International diffusion tubes have been consistently used for many years by Sussex Local Authorities using the 20% TEA in water method.
2020 diffusion tube monitoring covered eleven periods and most of these alternated between four- and five-week exposure periods. The notable exception is one longer period from 8 April 2020 during the COVID-19 travel restrictions, before the laboratory shutdown.
Accreditation of the diffusion tube monitoring method like in previous years is as follows:
Diffusion tube annualisation
Annualisation is required for any site with data capture of less than 75% but greater than 25%. For 2020 5 diffusion tube sites required annualisation these are detailed in Table C.2.
Diffusion tube bias adjustment factors
The diffusion tube data presented within the 2020 ASR have been corrected for bias using an adjustment factor. Bias represents the overall tendency of the diffusion tubes to under or over-read relative to the reference chemiluminescence analyser or regulatory monitor.
LAQM.TG16 guides the application of a bias adjustment factor to correct diffusion tube monitoring. Triplicate co-location studies can be used to determine a local bias factor based on the comparison of diffusion tube results with data taken from NOx/NO2 continuous analysers. Alternatively, the national database of diffusion tube co-location surveys provides bias factors for the relevant laboratory and preparation method.
Brighton & Hove have applied a local bias adjustment factor of 0.95 to the 2020 monitoring data using a triplicate co-location factor derived from automatic analyser BH10 on North Street.
This site in AQMA 1 and the ULEZ is most representative of the local area. The 2020 local bias correction factor is consistent with those used by Brighton & Hove over the past decade. This is important given that trend graphs have been presented since 2008 or 2010. A summary of bias adjustment factors used by Brighton & Hove over the past 5 years is presented in Table C.1.
Table C.1 – Bias adjustment factor
NO2 Fall-off with Distance from the Road
Brighton & Hove has ensured that monitoring locations represent exposure on a building line façade or equal distance between the traffic sources and receptor.
Kerbside monitors in AQMA1 declared for the hourly mean assess transient exposure to pollutants above busy footways. Some of Brighton & Hove’s monitors are at background locations or are compliant with standards and therefore do not require a NO2 fall-off with distance calculation. No diffusion tube NO2 monitoring locations within Brighton & Hove required distance correction during 2020.
In practice the NO2 fall-off with distance calculator works best for open field settings and is less suited to confined spaces, the lee side of buildings and street canyons, which are the typical scenario for significant portions of Brighton & Hove’s AQMAs declared in 2020.
QA/QC of automatic monitoring
TRL carry out the QA/QC on behalf of Brighton & Hove Council for the monitoring stations BH6 and BH10 on Lewes Road and North Street.
Site operation
Routine instrument calibrations are conducted approximately once per fortnight, which involve zero and span checks, a written record of the gas analyser diagnostics and a general visual inspection of all equipment is undertaken. There is a written operating procedure and a calibration record sheet is completed at every site visit.
Data retrieval and daily data checking
Data from the monitoring station is retrieved directly via a Siemens TC35i GSM modem at 8-hour intervals.
The data is then stored on Envista Arm software hosted at TRL. This was used to retrieve, check and archive data. TRL's internal QA/QC procedures require all data to be backed up on a secure server and all documentation associated with each site to be uniquely identified and securely stored to provide an audit trail.
Daily data inspections are undertaken during office hours using the facilities of the Data Management System. Initial observations of the Management System indicate whether the site has been contacted during its nominated ‘poll time’ overnight. If this has not been successful a manual poll of the site may be required. If this is not successful further investigation of the communications integrity will be required to establish contact with the site modem and data logger.
Three-day plots of recorded data are viewed for the requested site, and these are inspected and assessed for continuity, validity, minimum and maximum values, date and time, power failures and general integrity.
All anomalies are recorded on the Daily Check log, as required. Any anomalies or queries arising from daily inspection of data, or system operation, are brought to the attention of the Project Manager who will evaluate the situation, and initialise any necessary action.
In the event that the PM is not available, contact will be made with the next available senior person within the monitoring team. Any issues identified with equipment operation will be referred to the client for attention within 24 hours (excluding weekends).
On a weekly basis, data are examined using summary statistics and outlier analysis to establish data validity. If unusual data episodes are recorded, these would be routinely examined over longer data periods to establish their impact on trends but would also be cross-referenced with data peaks and troughs recorded at other national monitoring stations.
In addition, the integrity and validity of data logger clock times are checked, and any significant errors are recorded in the Data Management System logbook. All site data recorded through the Data Management System is archived on TRL’s Network.
The data is backed up daily, and the TRL IT Department maintains this data within their long-term and secure archives. This secures all data in the event of any system failure.
Data calibration and ratification
Data is ratified as per Automatic Urban Rural Network (AURN) recommended procedures. The calibration and ratification process for automatic gas analysers corrects the raw dataset for any drift in the zero baseline and the upper range of the instrument. This is done using Evista-based calibration and ratification which incorporates the zero and span check information from the calibration visits.
The zero-reading recorded during the calibration visits is used to adjust any offset of the baseline of the data. The difference between the span value obtained between one calibration visit and the next visit is used to calculate a factor. This change is assumed to occur at the same rate over the period between calibrations and as such the factor is used as a linear data scaler. This effectively results in the start of the period having no factor applied and the end of the period being scaled with the full factor with a sliding scale of the factor in between.
After applying the calibration factors, it is essential to screen the data, by visual examination, to see if they contain any unusual measurements or outliers. Errors in the data may occur because of equipment failure, human error, power failures, interference, or other disturbances.
Data validation and ratification is an important step in the monitoring process. Ratification involves considerable knowledge of pollutant behaviour and dispersion, instrumentation characteristics, field experience and judgement. On completion of this data correction procedure, the data is converted to hourly means and provided to Brighton & Hove City Council at quarterly intervals and a calendar year annual report is prepared.
Table C.2 – Annualisation summary - concentrations presented in µg/m3
Table C.3 – Local bias adjustment calculation
Notes
Overall Diffusion Tube Precision: Good.
Overall Continuous Monitor Data Capture: Good.
A single local bias adjustment factor has been used to bias adjust the 2020 diffusion tube results.
Appendix D: Maps of monitoring locations and AQMAs
Figure D.1 – Automatic monitoring site
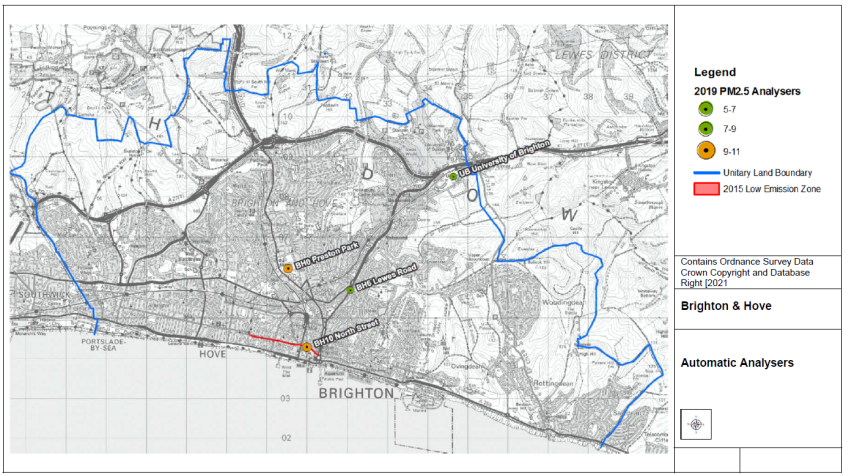
Figure D.1 - a map showing particulate monitoring locations in Brighton & Hove compared to the City Council Boundary. The Ultralow Emission Zone for buses is also shown.
Figure D.2 - 2020 Six AQMAs
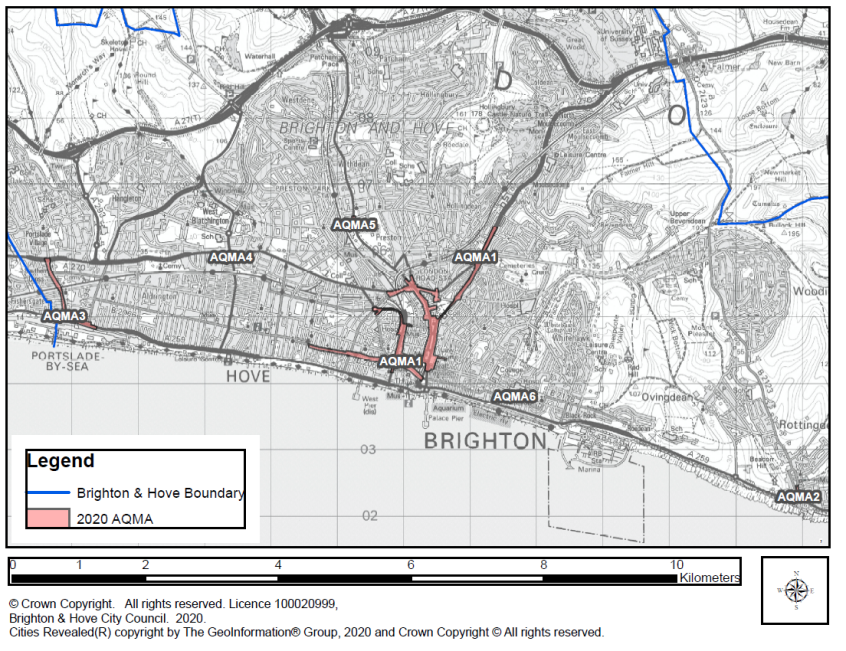
Figure D.2 - a map labelling the six Air Quality Management Areas (AQMAs) across Brighton & Hove. The smaller AQMAs consist of one or two streets and are located with the label.
Figure D.3 – Diffusion tube monitoring sites AQMA1 A23
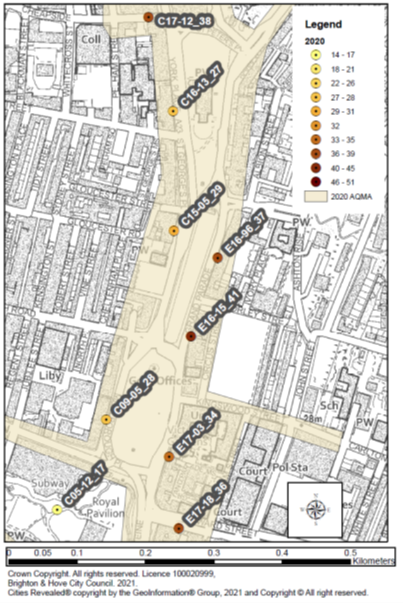
Figure D.3 - a map showing diffusion tube monitoring sites in the vicinity of the A23 and Valley Gardens 1 & II. The monitoring site names and NO2 concentrations recorded in 2020 are labelled. The colour-coded points on the map are ranked by NO2 concentration and relate to the results reported in the table.
Note
Label shows Diffusion Tube Area: C Central, W West and E East and the year started. The number after diffusion tubes is the 2020 NO2 result rounded to a whole number for presentation purposes.
Improvement at monitors C09, C15 and C16 occurred one year before the AQMA declaration.
Figure D.4 – Non-automatic monitoring sites AQMA1 ULEZ
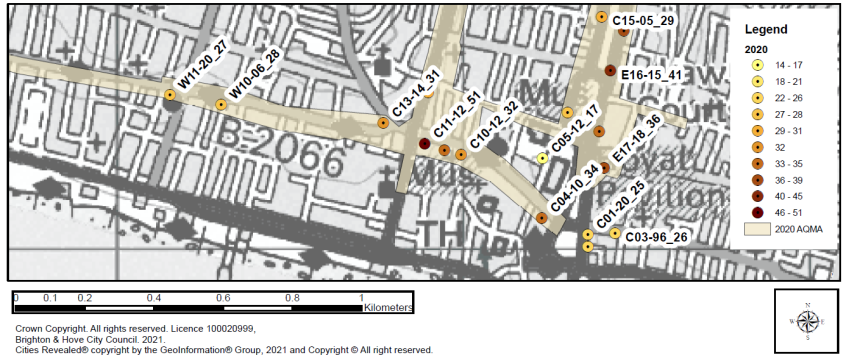
Figure D.4 - a map showing diffusion tube monitoring sites in the vicinity of the ULEZ and Valley Gardens South. The monitoring site names and NO2 concentrations recorded in 2020 are labelled. The colour-coded points on the map are ranked by NO2 concentration and relate to the results reported in the table.
Figure D.5 – Non-automatic monitoring sites AQMA1 main railway station approach
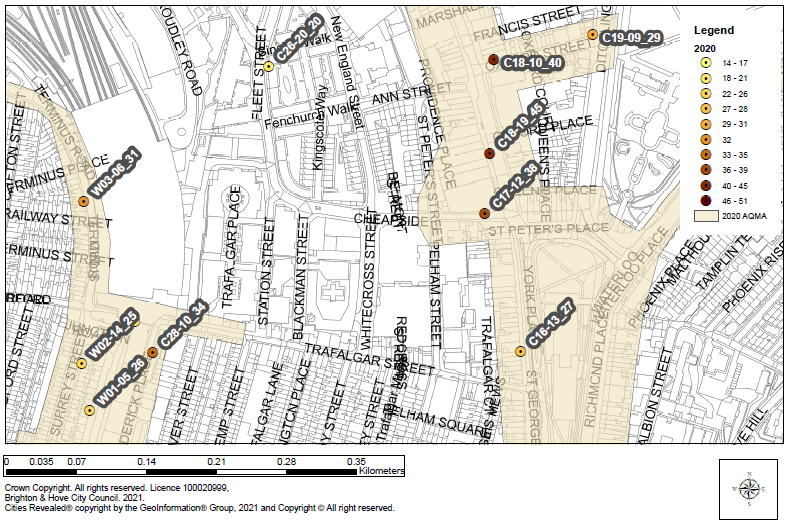
Figure D.5 - a map showing diffusion tube monitoring sites in the vicinity of the Brighton main railway station and London Road. The monitoring site names and NO2 concentrations recorded in 2020 are labelled. The colour-coded points on the map are ranked by NO2 concentration and relate to the results reported in the table.
Figure D.6 – Non-automatic monitoring sites AQMA1 Preston Circus A23-A270
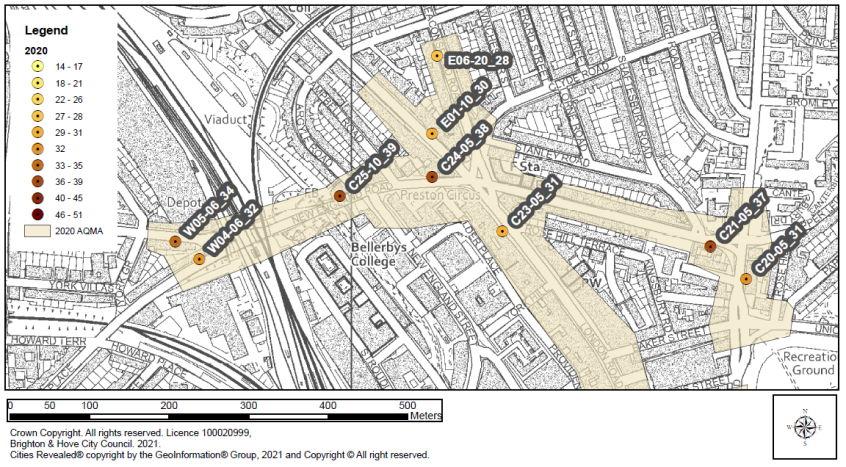
Figure D.6 - a map showing diffusion tube monitoring sites from Old Shoreham Road along New England Road through Preston Circus to Viaduct Terrace. The monitoring site names and NO2 concentrations recorded in 2020 are labelled. The colour-coded points on the map are ranked by NO2 concentration and relate to the results reported in the table.
Figure D.7 – Non-automatic monitoring sites AQMA1 Lewes Road-A270
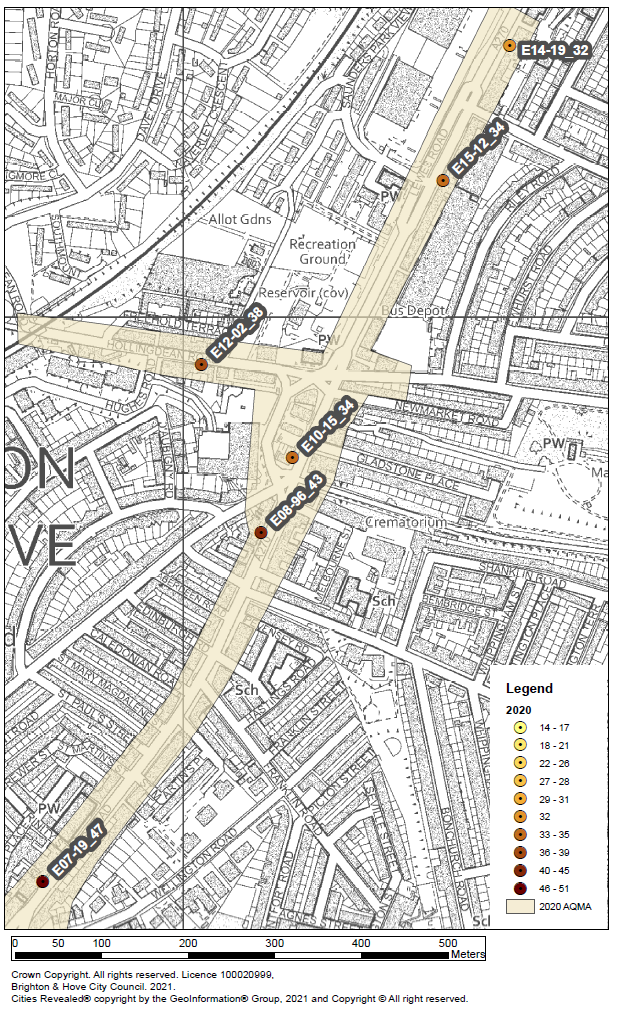
Figure D.7 - a map showing diffusion tube monitoring sites along the Lewes Road corridor and Hollingdean Road. The monitoring site names and NO2 concentrations recorded in 2020 are labelled. The colour-coded points on the map are ranked by NO2 concentration and relate to the results reported in the table.
Figure D.8a – Non-automatic monitoring sites AQMA2 Rottingdean B2123 and A259
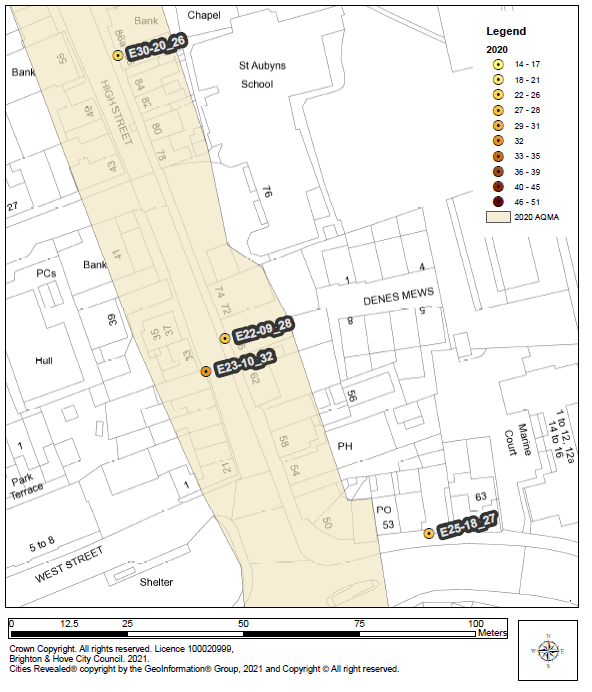
Figure D.8a - a map showing diffusion tube monitoring sites in Rottingdean. The monitoring site names and NO2 concentrations recorded in 2020 are labelled. The colour-coded points on the map are ranked by NO2 concentration and relate to the results reported in the table. Where monitors are close together a larger-scale inset map is included.
Figure D.8b – Non-automatic monitoring sites AQMA2 Rottingdean B2123 and A259
Figure D.8b - a map showing diffusion tube monitoring sites in Rottingdean. The monitoring site names and NO2 concentrations recorded in 2020 are labelled. The colour-coded points on the map are ranked by NO2 concentration and relate to the results reported in the table. Where monitors are close together a larger-scale inset map is included.
Figure D.9– Non-automatic monitoring sites AQMA3 Portslade A293 and A259
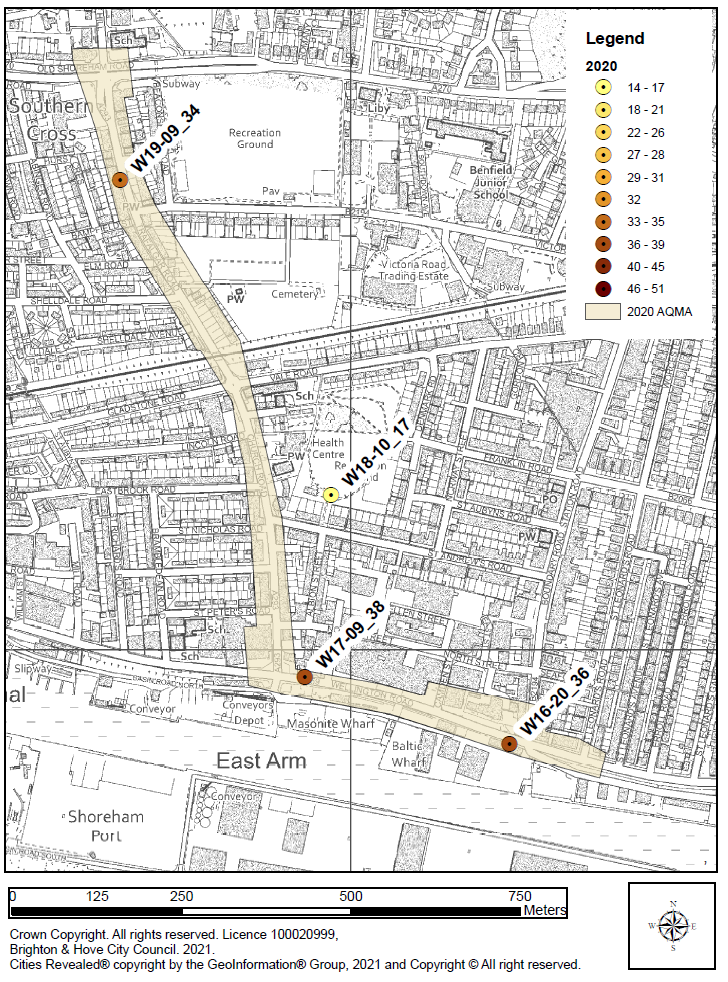
Figure D.9 - a map showing diffusion tube monitoring sites in South Portslade AQMA3. The monitoring site names and NO2 concentrations recorded in 2020 are labelled. The colour-coded points on the map are ranked by NO2 concentration and relate to the results reported in the table. Three active monitors are at the roadside and one in Vale Park is located in the background.
Figure D.20– Non-automatic monitoring sites AQMA5 South Street and Preston Road section of A23
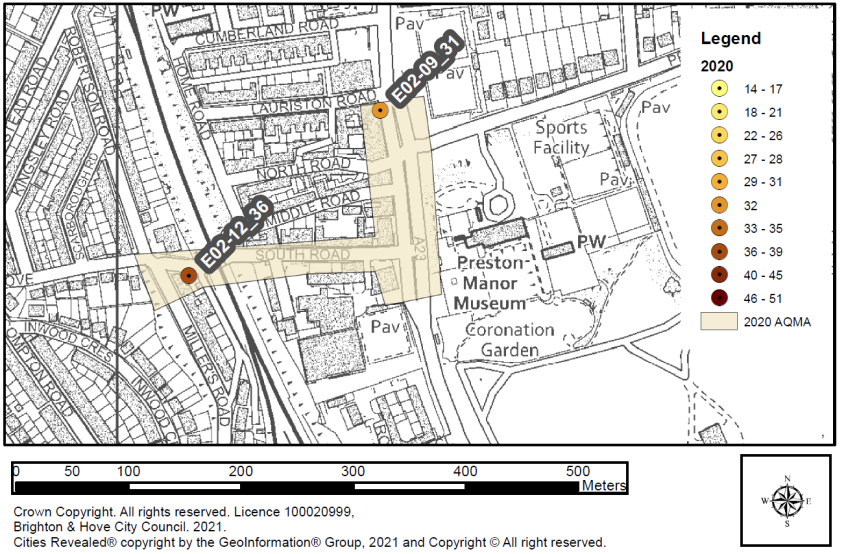
Figure D.20 - a map showing diffusion tube monitoring sites in AQMA5. The site names and NO2 concentration recorded in 2020 are labelled. This cross-references to the tables in the report. The colour-coded points relate to NO2 concentration. Both sites are at the roadside with E02 started in 2012 next to the road traffic hill climb on South Street.
Appendix E: Summary of English air quality standards
Table E.1 – Air quality standards in England
View and download Table E.1 or view the information listed below.
The units are in microgrammes of pollutants per cubic metre of air (μg/m3).
Listed below is the:
- Pollutant
- Air Quality Objective: Concentration
- Air Quality Objective: Measured as
Nitrogen Dioxide (NO2)
- 200μg/m3 not to be exceeded more than 18 times a year
- 1-hour mean
Nitrogen Dioxide (NO2)
- 40μg/m3
- Annual mean
Particulate Matter (PM10)
- 50μg/m3, not to be exceeded more than 35 times a year
- 24-hour mean
Particulate Matter (PM10)
- 40μg/m3
- Annual mean
Sulphur Dioxide (SO2)
- 350μg/m3, not to be exceeded more than 24 times a year
- 1-hour mean
Sulphur Dioxide (SO2)
- 125μg/m3, not to be exceeded more than 3 times a year
- 24-hour mean
Sulphur Dioxide (SO2/)
- 266μg/m3, not to be exceeded more than 35 times a year
- 15-minute mean
Appendix F: Impact of COVID-19 upon LAQM
COVID-19 has had a significant impact on society. Inevitably, COVID-19 has also had an impact on the environment, with implications for air quality at local, regional, and national scales.
COVID-19 has presented various challenges for Local Authorities concerning undertaking their statutory LAQM (Local Air Quality Management) duties in the 2021 reporting year. Recognising this, Defra provided various advice updates throughout 2020 to English authorities, particularly concerning the potential disruption to air quality monitoring programmes, implementation of Air Quality Action Plans (AQAPs) and LAQM statutory reporting requirements. Defra has also issued supplementary guidance for LAQM reporting in 2021 to assist local authorities in preparing their 2021 ASR. Where applicable, this advice has been followed.
Despite the challenges that the pandemic has given rise to, the events of 2020 have also provided Local Authorities with an opportunity to quantify the air quality impacts associated with wide-scale and extreme intervention, most notably about emissions of air pollutants arising from road traffic. It was an excellent opportunity to monitor differences and very important that monitoring continued despite staff being lost to organisations.
The vast majority (>95%) of AQMAs declared within the UK are related to road traffic emissions, where attainment of the annual mean objective for nitrogen dioxide (NO2) is considered unlikely. On 23 March 2020, the UK Government released official guidance advising all members of the public to stay at home, with work-related travel only permitted when necessary. During this initial national lockdown (and to a lesser extent other national and regional lockdowns that followed), marked reductions in vehicle traffic were observed; Department for Transport (DfT) data (Prime Minister’s Office, COVID-19 briefing on the 31 of May 2020) suggests reductions in vehicle traffic of 70% were experienced across the UK by mid-April, relative to pre COVID-19 levels.
This reduction in travel in turn gave rise to a change in air pollutant emissions associated with road traffic, such as nitrous oxides (NOx), and exhaust and non-exhaust particulates (PM). The Air Quality Expert Group (AQEG) has estimated that during the initial lockdown period in 2020, within urbanised areas of the UK reductions in NO2 annual mean concentrations were between 20 and 30% relative to pre-pandemic levels, which represents an absolute reduction of between 10 to 20µg/m3 if expressed relative to annual mean averages.
(Air Quality Expert Group, Estimation of changes in air pollution emissions, concentrations and exposure during the COVID-19 outbreak in the UK, June 2020)
During this period, changes in PM2.5 concentrations were less marked than those of NO2. PM2.5 concentrations are affected by both local sources and the transport of pollution from wider regions, often from well beyond the UK. Through analysis of AURN monitoring data for 2018 to 2020, AQEG have detailed that PM2.5 concentrations during the initial lockdown period are of the order 2 to 5µg/m3 lower relative to those that would be expected under business-as-usual conditions.
As restrictions are gradually lifted, the challenge is to understand how these air quality improvements can benefit the long-term health of the population.
Impacts of COVID-19 on Air Quality within Brighton & Hove
Further analysis will be included as part of the detailed air quality assessment prior to Environment Transport Sustainability (ETs) committee.
Figure E.3 Nitrogen Dioxide AQMA1 Automatic Analysers 2020 compared with 2019
North Street
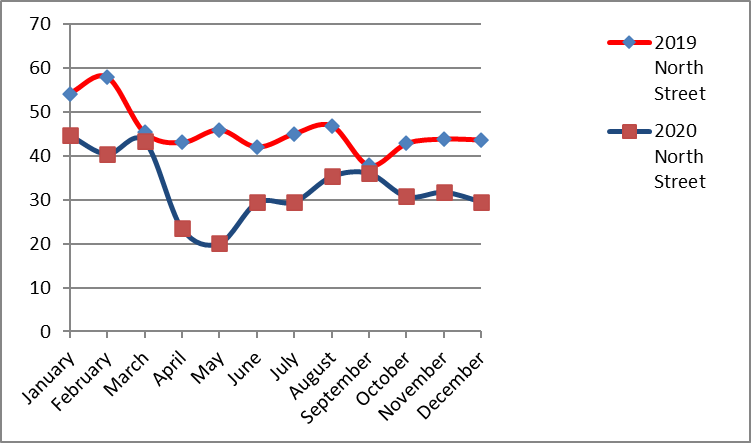
Lewes Road
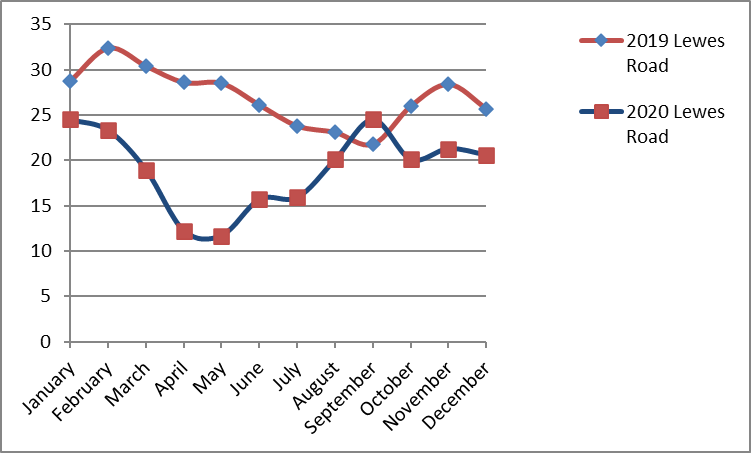
The 2 charts compare nitrogen dioxide levels during 2020 with 2019.
The data is based on results from the automatic monitoring stations in AQMA1. Results suggest substantially lower levels in the second quarter of 2020 compared to the same quarter of the previous year.
Reductions of NO2 concentrations of 57% were experienced at roadside automatic analysers within AQMA 1, between April and May 2020. This equated to a 30% reduction in outdoor annual mean concentrations (not emissions) relative to 2019 and a more substantial reduction compared with 2017 & 2018. For roadside NO2 to improve this much road traffic emissions of NO + NO2 would have needed to be less than half. The reduction in NO2 experienced within the first half of 2020 has allowed the Council to provide an evidence base in relation to the annual mean objective being achievable for some, but not all areas.
The later part of February 2020 before lockdowns, had stormy weather with high winds, that helped with dilution and dispersion of emissions. The most polluted hours of the year during 2020 were substantially lower compared to 2017 and 2018. Since 2019 the highest levels of pollution show comparatively weaker correlation with commuting peaks for example 8am and 5pm rush hours. The influence of collegiate and school runs on motorised traffic emissions diminished during 2020. It appears that a higher proportion of vehicle trips were associated with servicing, food and goods distribution, construction work and Brighton & Hove visitor journeys.
Figure E.2 - NO2 AQMA1 Diffusion Tubes 2020 compared with 2019
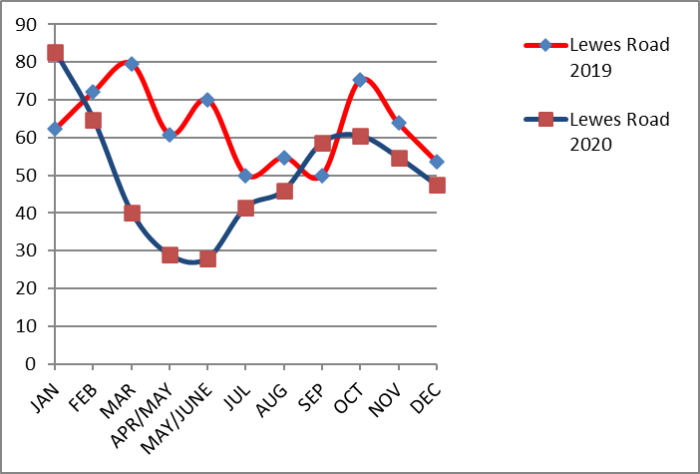
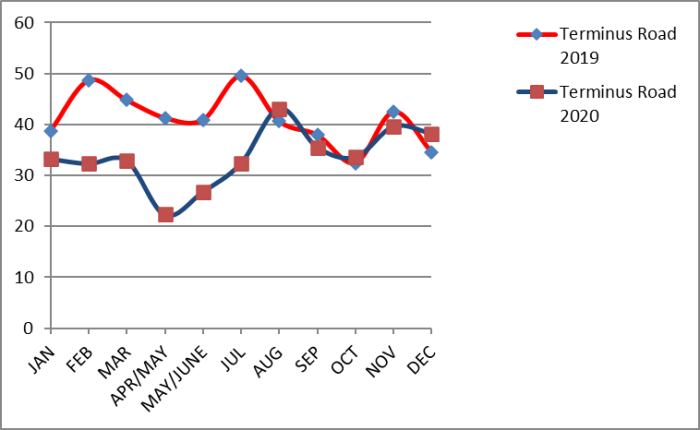
The 2 charts compare nitrogen dioxide levels during 2020 with 2019.
The trends are based on results from diffusion tubes located on Lewes Road and Terminus Road. Results suggest substantially lower levels in the second quarter of 2020 compared to the same quarter of the previous year. The later part of the year shows a closer agreement.
Monitoring on Lewes Road (north of Elm Grove) in AQMA1 suggested more than a 50% improvement in the springtime NO2. The only months with higher levels in 2020 compared to 2019 were January and September before and after travel restrictions. Monitoring on Terminus Road near Brighton’s main railway stations suggested a 46% improvement around April, that said NO2 concentrations tacked the previous year from August onwards.
Figure E.3 - NO2 AQMA3 and AQMA 5 Diffusion Tubes 2020 compared with 2019
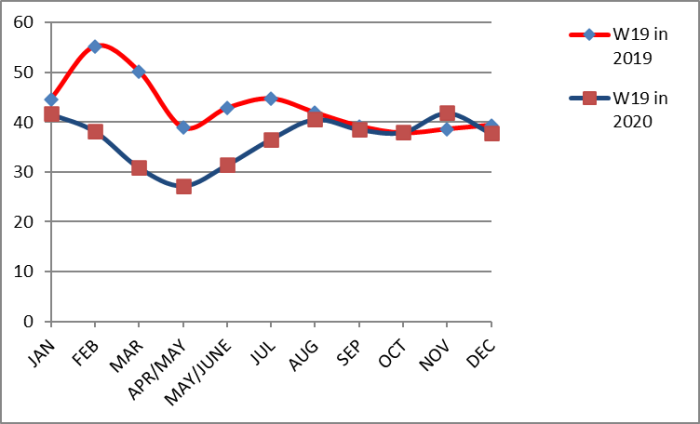
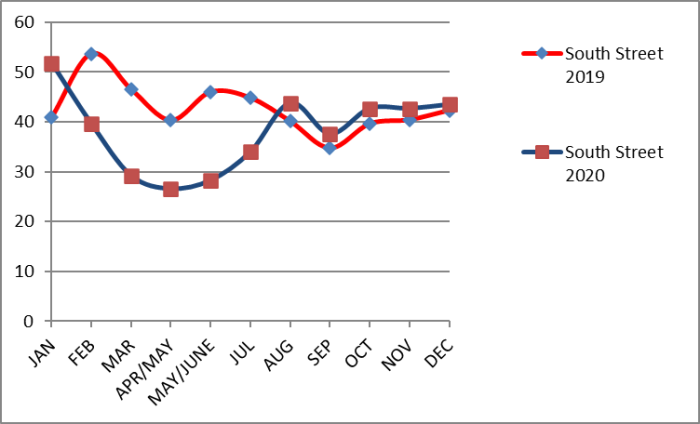
The 2 charts compare nitrogen dioxide levels during 2020 with 2019.
The trends are based on results from diffusion tubes located AQMA3 and AQMA5. Results suggest substantially lower levels in the first half of 2020 compared to the first half of the previous year. The later part of the year shows a closer agreement.
Opportunities Presented by COVID-19 upon LAQM within Brighton & Hove
Temporary Cycle Lanes – A temporary cycle lane was implemented on Marine Drive and Old Shoreham Road from April 2020.
Homeworking and a substantial drop in commuting and vehicular access to railway stations. On the whole homeworking has generally been more productive.
Challenges and Constraints Imposed by COVID-19 upon LAQM within Brighton & Hove
April 2020, staff movement restrictions and laboratory closures limited diffusion tube monitoring change overs. Therefore, it was not possible to maintain diffusion tube schedule changes in line with the national monitoring calendar. This did not affect constant data capture through 2020. Extra effort was required from one staff member to utilise the samples supplied. 51/56 samples did not require annualisation and in most case eleven instead of twelve periods were returned to the laboratory for analysis. Small Impact.
A revised AQAP is being developed for six NO2 AQMAs, there is also public interest to advance monitoring and action to improve dust and particles. Progress has made with this over the past twelve months. Time is required to update the detailed air quality assessment and allow for the consultation and committee process. Current estimates are that a new AQAP will be prepared and sent out for draft consultation towards the end of 2021. Small Impact.
There have been delays during 2020 accessing computer hardware, software, and networks. Large Impact.
Table F 1 – Impact Matrix
Glossary of terms
Abbreviation | Description |
|---|---|
| ADMS-Urban | Atmospheric Dispersion Model System |
| AQAP | Air Quality Action Plan - A detailed description of measures, outcomes, achievement dates and implementation methods, showing how the local authority intends to achieve air quality limit values’ |
| AQMA | Air Quality Management Area – An area where air pollutant concentrations exceed / are likely to exceed the relevant air quality objectives. AQMAs are declared for specific pollutants and objectives |
| ASR | Air Quality Annual Status Report |
| ATC | Automatic Traffic Counter |
| AURN | UK Automatic Urban Rural air Monitoring Network |
| CAZ | Clean Air Zone |
| CEMP | Construction Environment Management Plans |
| COMEAP | Committee on the Medical Effects of Air Pollutants |
| Defra | Department for Environment, Food and Rural Affairs |
| DfT | Department for Transport |
| DMRB | Design Manual for Roads and Bridges – Air quality screening tool produced by Highways England |
| EFT | Emission Factor Toolkit |
| EMIT | Atmospheric Emissions Inventory Toolkit |
| EU | European Union |
| HGV | Heavy Goods Vehicle |
| LAQM | Local Air Quality Management |
| LAQM (TG)16 | LAQM Technical Guidance 2016 |
| LAQM (PG)16 | LAQM Policy Guidance 2016 |
| LGV | Light Goods Vehicle |
| NRMM | Non-Road Mobile Machinery |
| NAEI | National Atmospheric Emissions Inventory |
| NO2 | Nitrogen Dioxide |
| NOx | Oxides of Nitrogen usually an emission rather than an outdoor concentration |
| NPL | National Physical Laboratory |
| PHE | Public Health England |
| PHOF | Public Health Outcomes Framework |
| PM10 | Airborne particulate matter with an aerodynamic diameter of 10µm (micrometres or microns) or less |
| PM2.5 | Airborne particulate matter with an aerodynamic diameter of 2.5µm or less |
| QA/QC | Quality Assurance and Quality Control |
| SCA | Smoke Control Zone |
| Section 106 | Section 106 Planning Agreement Under Town and Country Planning Act |
| SO2 | Sulphur Dioxide |
| ULEZ | Ultralow Emissions Zone |
References
Local Air Quality Management Technical Guidance LAQM.TG16. April 2021. Published by Defra in partnership with the Scottish Government, Welsh Assembly Government and Department of the Environment Northern Ireland.
Local Air Quality Management Policy Guidance LAQM.PG16. May 2016. Published by Defra in partnership with the Scottish Government, Welsh Assembly Government and Department of the Environment Northern Ireland.
Sections Executive Summary: Air Quality in Our Area to Local Engagement and How to get Involved
2020 Ozone Episode Covid-19 lockdown caused complex and harmful local air quality effects | Phlorum.
“Bricycles” Brighton & Hove Cycling Campaign.