Tables A.1 to A.4
View and download the following tables:
- Table A.1 – Details of Automatic Monitoring Sites
- Table A.2 – Details of Non-Automatic Monitoring Site Nitrogen Dioxide (Sorted by AQMAs and Road Numbers)
- Table A.3 – Annual Mean NO2 Monitoring Results: Automatic Monitoring (µg/m3)
- Table A.4 – Annual Mean NO2 Monitoring Results: Non-Automatic Monitoring (µg/m3)
Notes for Table A.1
- 0m if the monitoring site is at a location of exposure (for example, installed on the façade of a residential property)
- N/A if not applicable
Notes for Table A.2
- All tubes are at a relevant receptor location (apart from those at background). All tubes are singular, except C10-12 triplicate average, co-located with analyser BH10. This list starts at the main railway station.
- Where “Main road” names for example (A23) are in brackets the tube sample is adjacent to an unclassified road, adjoining the AQMA-main road cited.
- At the time of writing the bus-ULEZ (LEZ since 2015) follows the B2066 road for 1.8 km, which is mostly used by buses, taxis and service delivery.
- Diffusion Tube IDs relate to changing order: W = West, C = Central and E = East. The second number is the year sampling started at the site. 2021 are new for this ASR, all other tubes are ‘existing’ or continued from 2020. Long-term tubes (and some that have discontinued due to compliance status) are included in the trend graphs.
Notes for Table A.3
Annualisation has been conducted where data capture is <75% and >25% in line with LAQM.TG16
Reported concentrations are those at the location of the monitoring site (annualised, as required), such as, prior to any fall-off with distance correction
- The annual mean concentrations are presented as µg/m3.
- Exceedances of the NO2 annual mean objective of 40 µg/m3 are shown in bold.
- All means have been “annualised” as per LAQM.TG16 if valid data capture for the full calendar year is less than 75%. See Appendix C for details.
- Concentrations are those at the location of monitoring and not those following any fall-off with distance adjustment.
- (1) Data capture for the monitoring period, in cases where monitoring was only carried out for part of the year.
- (2) Data capture for the full calendar year (for example, if monitoring was carried out for 6 months, the maximum data capture for the full calendar year is 50%).
Notes for Table A.4
Annualisation has been conducted where data capture is <75% and >25% in line with LAQM.TG16
Diffusion tube data has been bias adjusted
Reported concentrations are those at the location of the monitoring site (bias adjusted and annualised, as required), such as, prior to any fall-off with distance correction.
- The annual mean concentrations are presented as µg/m3.
- Exceedances of the NO2 annual mean objective of 40 µg/m3 are shown in bold.
- NO2 annual means exceeding 60µg/m3, indicating a potential exceedance of the NO2 1-hour mean objective are shown in bold and underlined.
- Means for diffusion tubes have been corrected for bias. All means have been “annualised” as per LAQM.TG16 if valid data capture for the full calendar year is less than 75%. See Appendix C for details.
- Concentrations are those at the location of monitoring and not those following any fall-off with distance adjustment.
- (1) Data capture for the monitoring period, in cases where monitoring was only carried out for part of the year.
- (2) Data capture for the full calendar year (for example, if monitoring was carried out for 6 months, the maximum data capture for the full calendar year is 50%).
Figure A.1 – Trends in Annual Mean NO2 Concentrations
A series of graphs showing long term trends in Nitrogen Dioxide at roadside compared with background (not near a road) declining since 2010 to 2020 and 2021, with a varying rate of improvement.
Figure A.1 AQMA1 A23 Valley Gardens II and III
Figure A.1 AQMA1 A23 Valley Gardens II and III Trend graph presents NO2 annual mean concentrations for monitoring sites either side of Valley Gardens and the A23 main road.
On the west side of Valley Gardens in 2011 the average of two sites (Marlborough Place and Gloucester Place) at the facade was close to 56 µg/m3 NO2, during the past decade the concentration at these locations has improved by 50%. On the west side of Valley Gardens five years ago the average of three sites was 42 µg/m3, in 2021 this was recorded at 28 µg/m3 an improvement of 33%.
On the east side of Valley Gardens in 2011 the average of two sites on Grand Parade facade was close to 51 µg/m3 NO2, during the past decade the concentration at these locations has improved by >32%. On the east side of Valley Gardens five years ago, the average of three sites was 45 µg/m3, in 2021 this average and changed to 36 µg/m3 an improvement of 21%. Recently monitoring adjacent with A23 through traffic suggests NO2 is not improving as fast as elsewhere in the AQMAs.
In September 2019 general traffic was switched to the east side of the Valley and the west side mostly limited to buses and taxis.
The rate of pollution improvement has slowed since 2020, partly because that calendar year included lockdown periods and it is taking longer to supply replacement vehicles.
Figure A.1 AQMA1 A23 Preston Circus Area
The trend graph presents NO2 annual mean concentrations for monitoring sites in the London Road area south of Preston Circus. In 2011 the average of two sites was close to 60µg/m3 NO2, during the past decade the concentration at these locations has improved by 46%. The average of three sites south or Preston Circus five years ago was almost 50µg/m3 NO2 by 2021 this had become 33 µg/m3, an improvement of one third. There area is influenced by buses, taxis, and deliveries.
For the A23 southbound through Preston Circus the trend chart show ten years ago NO2 average at three sites was recorded at almost 55 µg/m3, during the past decade this pollution concentration has improved by 43%. The average of three sites for general traffic through Preston Circus five years ago was 43 µg/m3 NO2 by 2021 this had become 31 µg/m3 an improvement of 22%. Recently monitoring adjacent with A23 through traffic suggests NO2 is not improving as fast as elsewhere.
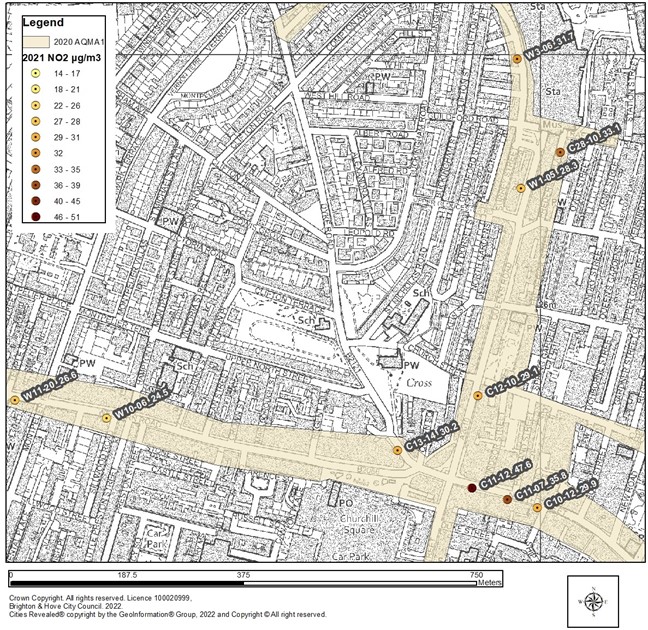
Figure A.1 AQMA1 ULEZ Kerbside (above pedestrian pavement)
One diffusion tube on North Street monitors above the pavement to represent the area where pedestrians (not residents) spend time. This diffusion tube has recorded the highest NO2 concentrations in Brighton & Hove and shows the greatest improvement. In 2014 NO2 at the site peaked at close to 121 µg/m3 by 2021 this had dropped to slightly under 48 µg/m3, an improvement 58% over 9 years, down almost 61% in 7 years and 51% in the past 5 years.
Whilst levels have improved citywide during the same period, the greater downward trend in the Ultralow Emission Zone is due to cleaner buses achieved with a combination of replacements, new procurements and exhaust upgrades funded by Department of Transport (DfT), Department for the Environment (DEFRA), Sustainability and Carbon Reduction Investment Fund (SCRIF) and bus operators and managed by officers at Brighton & Hove City Council. The number of operating buses increased after travel restrictions from mid-2020 into 2021.
Figure A.1 AQMA1 ULEZ Façade (roadside building-line compared with central background)
The trend graph presents NO2 annual mean concentrations for facade monitoring sites along Western Road, Lower Dyke Road (next to Churchill Square) North Street and Castle Square. In 2011 the average of three available sites was close to 68 µg/m3 NO2, during the past decade concentration at these locations has improved by 55%. The average of 5 available façade sites along the corridor five years ago was almost 46 µg/m3 NO2, by 2021 this had dropped to 30 µg/m3, an improvement of 35%. Bus emissions in the Ultralow Emission Zone have improved substantially with a combination of new procurement, replacements of older vehicles and grant funding from DfT, DEFRA, and carbon neutrality allocations to upgrade the exhausts of more than a hundred vehicles.
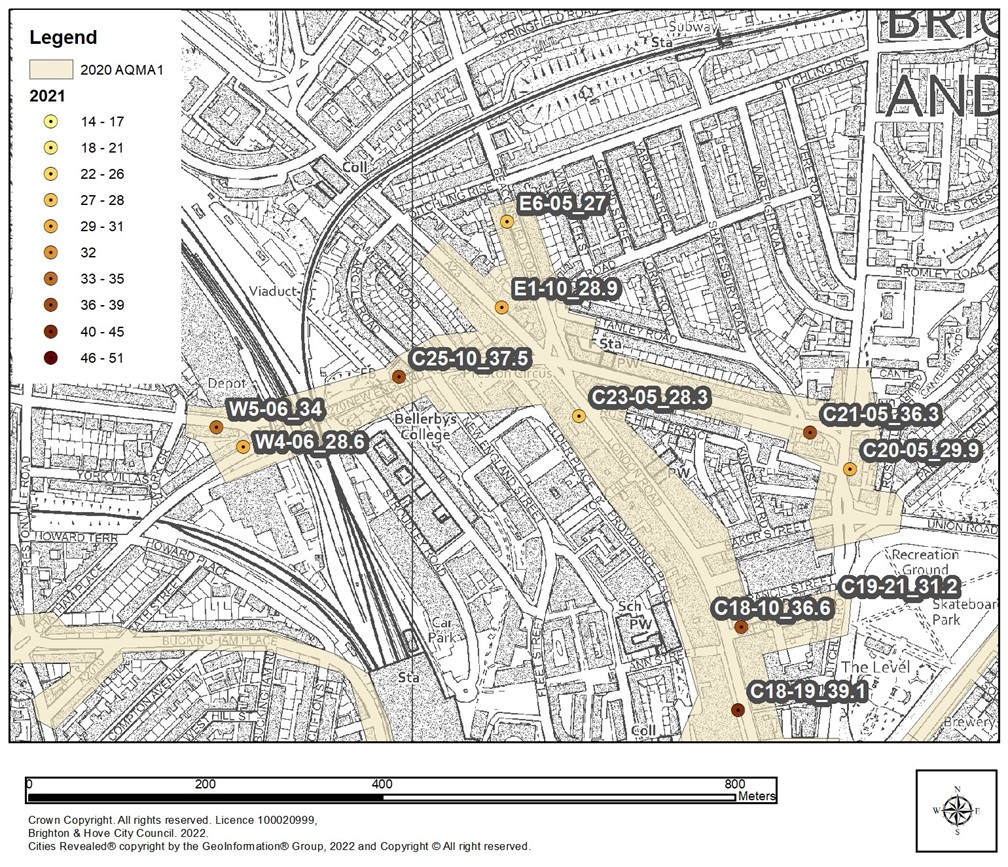
Figure A.1 AQMA1 A2010 Brighton Railway Station Approaches
The trend graph presents NO2 annual mean concentrations for facade monitoring sites next to the Main Railway Station. In 2011 NO2 on Terminus Road was recorded at 54 µg/m3 NO2, during the past decade concentration at this constant monitor have improved by 41%. The site five years ago recorded almost 43 µg/m3 NO2, by 2021 this had become >32 µg/m3, an improvement of 21%. Between 2018 and 2020 Surrey Street and the Station frontage recorded a reduction in NO2 of 44%. Whist Terminus road continues to carry mixed traffic on a hill climb in confined space between terrace houses and the railway station the station frontage and Surrey Street has much less car and taxi pick up and drop off activity.

Two diffusion tube monitoring locations have constantly monitored on Queens Road. In 2011 their average was close to 56 µg/m3 NO2, during the past decade this has improved 49%. Five years ago, the average of 2 site was 43 µg/m3 NO2, by 2021 this had dropped to 29 µg/m3, an improvement of 33%. Cleaner buses have helped, more recently there is reduced pick-up and drop off in front of Brighton railway station and possibly fewer private car trips for retail as shopping shifts online.
One constant tube monitored next to Frederick Place in north Laine in 2011 recorded 50 µg/m3 NO2, during the past decade this has improved 34%. Five years ago, the site monitored 46 µg/m3 NO2, by 2021 this had dropped to 33 µg/m3, an improvement of 28%. The road link is important for delivery access and would benefit from increased use of cargo bikes.
Figure A.1 AQMA1 A270
The trend graph presents NO2 annual mean concentrations for facade monitoring sites next to the Chatham Place, Old Shoreham East, and New England Road. In 2011 the average from three sites was close to 57 µg/m3 NO2, during the past decade concentration at these constant monitors has improved by 41%. Five years ago, the average of four site was 47 µg/m3 NO2, by 2021 this had dropped to 34 µg/m3, an improvement of 28%. The road link is an important east-west link under the Brighton main railway and can be congested at various times of the day.
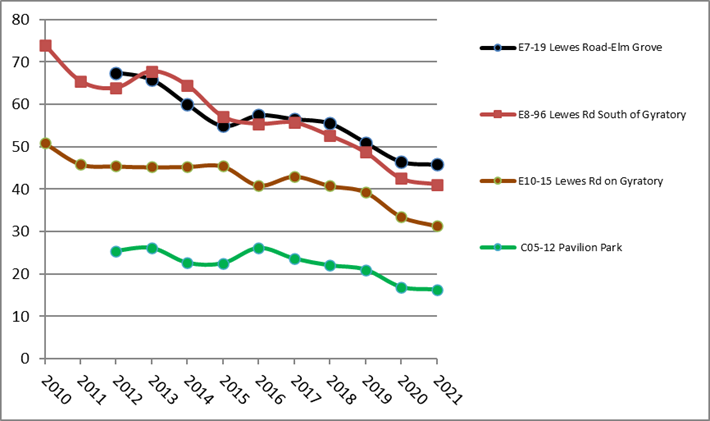
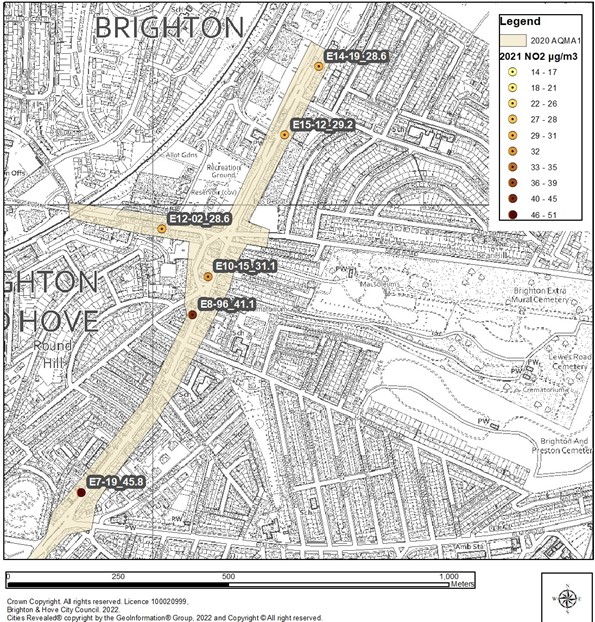
The trend graph presents NO2 annual mean concentrations for facade monitoring sites next to the Lewes Road corridor south of the Vogue Gyratory. In 2012 the average from three sites was close to 59 µg/m3 NO2, during the past nine years concentration at these monitors has improved by 33%. Five years ago, the average of two sites was 49 µg/m3 NO2, by 2021 this had dropped to 36 µg/m3, an improvement of 26%.

The trend graph presents NO2 annual mean concentrations for facade monitoring sites next to the Lewes Road corridor north of the Vogue Gyratory and Hollingdean Road. In 2012 the Coombe Terrace site recorded close to 48 µg/m3 NO2, during the past nine years concentration at this monitor has improved by 39%. Five years ago, the same site recorded almost 39 µg/m3 NO2, by 2021 this had dropped to 29 µg/m3, an improvement of 24%. In 2010 the Hollingdean Road monitor recorded close to 51 µg/m3 NO2, over eleven years concentration at the stie has improved by 44% or 39% in a decade. Five years ago, concentrations at the site were recorded at 46 µg/m3 NO2, by 2021 this had dropped to under 29 µg/m3, an improvement of 38%. Improvement to lorry emission will have helped, also the demolition of buildings flanking the road.
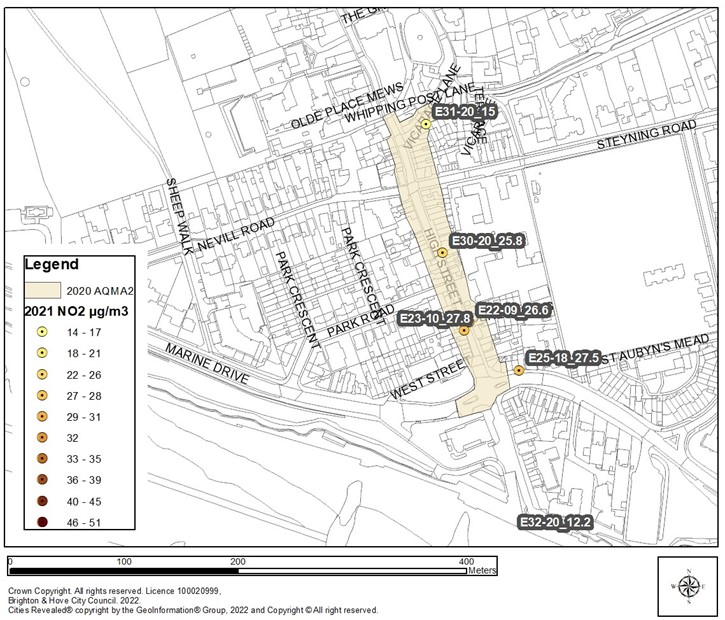
Figure A.1 AQMA2 Rottingdean Roadside (2021 Local Background monitored at 12 µg/m3)
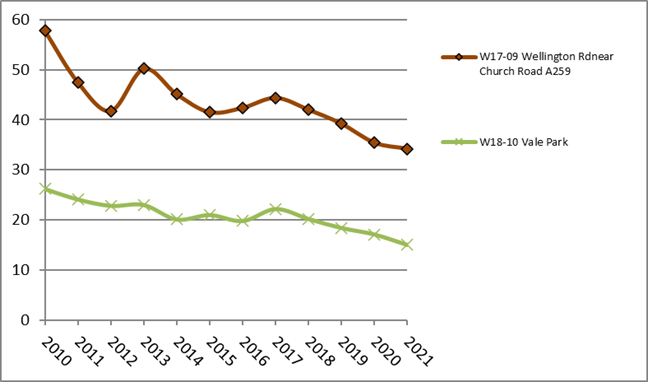
The trend graph presents NO2 annual mean concentrations for facade monitoring sites next Rottingdean High Street. In 2011 the average of two constant sites was close to 47 µg/m3 NO2, during the past decade concentration at the long-term monitors has improved by 42%. Five years ago, the same sites recorded more than 38 µg/m3 NO2, by 2021 this had dropped to 27 µg/m3, an improvement of 29%. Rottingdean High Street and the A259 contribute emissions to the diffusion tube monitors in AQMA2.
Figure A.1 AQMA3 South Portslade
The trend graph presents NO2 annual mean concentrations for the long-term facade monitoring site on Wellington Road. In 2011 the site recorded close to 48 µg/m3 NO2, during the past decade concentration at this monitor has improved by 29%. Five years ago, the same site recorded more than 44 µg/m3 NO2, by 2021 this had dropped to 34 µg/m3, an improvement of 23%.
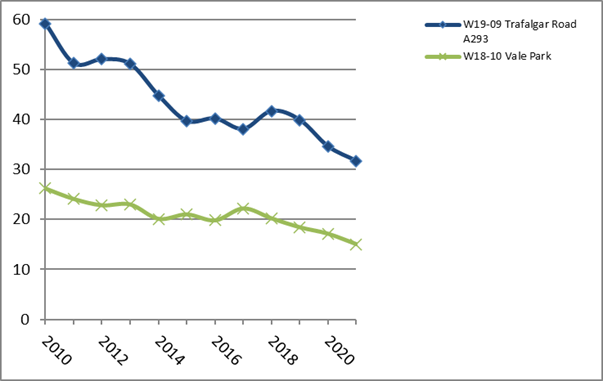
The trend graph presents NO2 annual mean concentrations for the long-term facade monitoring site on Trafalgar Road in Portslade. In 2011 the site recorded close to 51 µg/m3 NO2, during the past decade concentration at these monitors has improved by 38%. Five years ago, the same sites recorded 38 µg/m3 NO2, by 2021 this had dropped to less than 32 µg/m3, an improvement of 20%. The corridor is an important haulage route from Shoreham port inland. To further improve air quality, it will be important for all heavy vehicles to meet the euro-VI emission standard. It is also possible that local cars (Portslade and Adur) are older than elsewhere in the city.
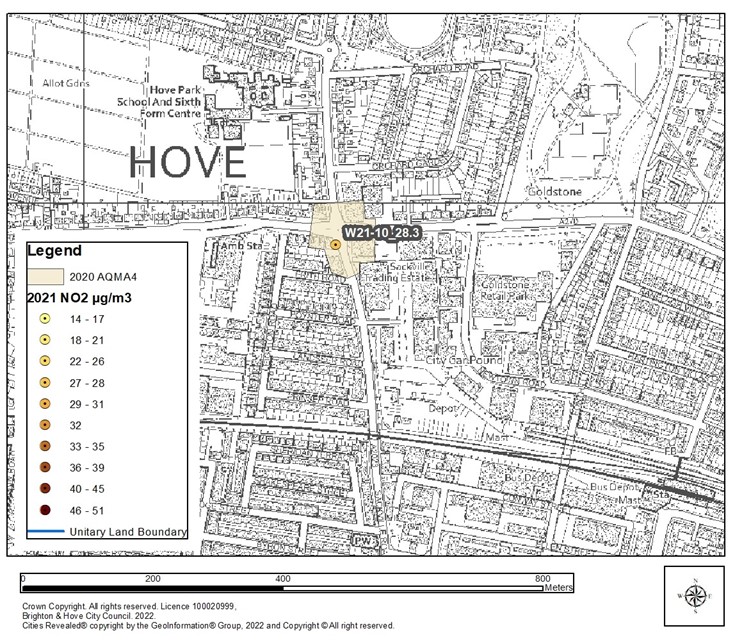
Figure A.1 AQMA4 and Hove
The trend graph presents NO2 annual mean concentrations for the long-term facade monitoring site on Sackville Road. In 2011 the site recorded close to 47 µg/m3 NO2, during the past decade concentration at these monitors has improved by 40%. Five years ago, the same sites recorded more than 39 µg/m3 NO2, by 2021 this had dropped to 28 µg/m3, an improvement of 28%. The junction is important for access to Hove. There are several developments in the area.
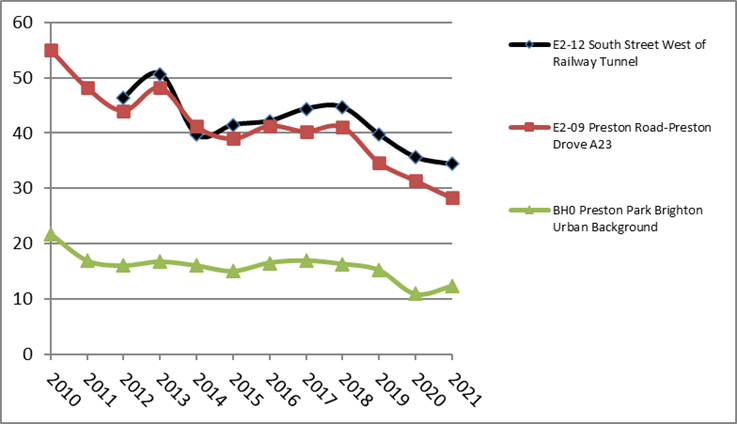
Figure A.1 AQMA5 Preston Road South Street-The Drove (west of the railway)
The trend graph presents NO2 annual mean concentrations for 2 monitors in AQMA5. In 2012 diffusion tube on The Drove recorded close to 47 µg/m3 NO2, over 9 years concentration at this monitor improved by 27%. Five years ago, the same sites recorded more than > 44 µg/m3 NO2, by 2021 this had dropped to 34 µg/m3, an improvement of 23%. The cross-over under the railway is an important east-west link. Car, van and minibus emissions occur on the hill climbing corner.
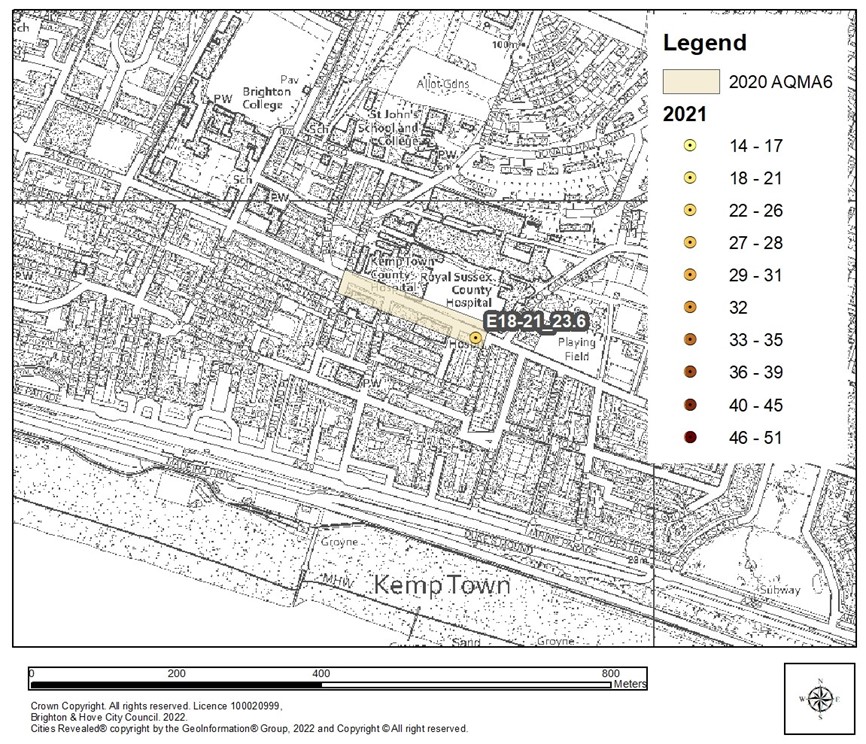
Figure A.1 AQMA6 south of the Royal County Hospital
The trend graph presents NO2 annual mean concentrations close to the Royal County Hospital and St James Street in Kemp Town. In 2011 the diffusion tube next to Eastern Road opposite the hospital campus recorded close to 47 µg/m3 NO2, over a decade the concentration at this monitor improved by almost 50%. Five years ago, the same site recorded more than 42 µg/m3 NO2, by 2021 this had dropped to 24 µg/m3, an improvement of 44%. Possible explanations are the reduced influence of construction activity emissions working at the hospital site, the moving of bus shelter on Eastern Road, reduced bus emissions, modal shift including fewer visits to the vicinity by older diesel cars.
Table A.5
View and download Table A.5 – 1-Hour Mean NO2 Monitoring Results, Number of 1-Hour Means > 200µg/m3.
Notes for Table A.5
Results are presented as the number of 1-hour periods where concentrations greater than 200µg/m3 have been recorded.
Exceedances of the NO2 1-hour mean objective (200µg/m3 not to be exceeded more than 18 times/year) are shown in bold.
If the period of valid data is less than 85%, the 99.8th percentile of 1-hour means is provided in brackets.
(1) Data capture for the monitoring period, in cases where monitoring was only carried out for part of the year.
(2) Data capture for the full calendar year (for example, if monitoring was carried out for 6 months, the maximum data capture for the full calendar year is 50%).
Figure A.2 – Trends in Number of NO2 1-Hour Means > 200µg/m3
Table A.8 – Annual Mean PM2.5 Monitoring Results (µg/m3)
View and download Table A.8 – Annual Mean PM2.5 Monitoring Results (µg/m3).
Notes for Table A.8
Annualisation has been conducted where data capture is <75% and >25% in line with LAQM.TG16
The annual mean concentrations are presented as µg/m3.
All means have been “annualised” as per LAQM.TG16 if valid data capture for the full calendar year is less than 75%. See Appendix C for details.
(1) Data capture for the monitoring period, in cases where monitoring was only carried out for part of the year.
(2) Data capture for the full calendar year (for example, if monitoring was carried out for 6 months, the maximum data capture for the full calendar year is 50%).
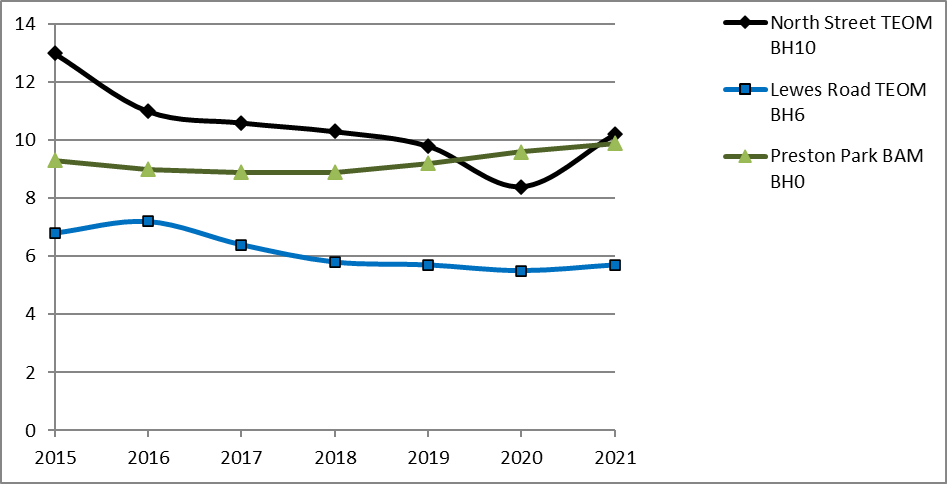
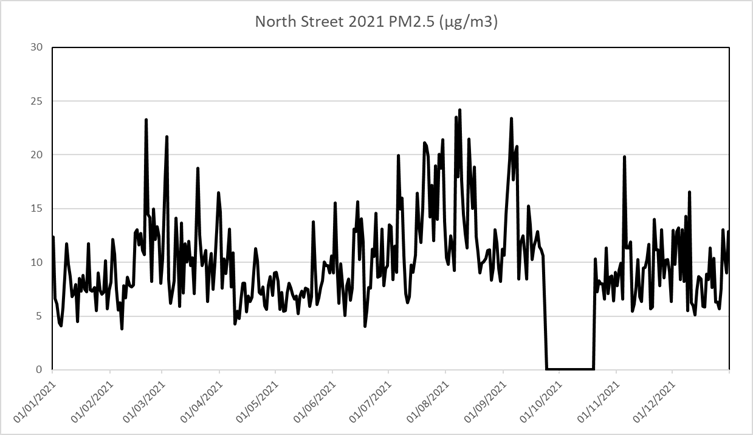
Figure A.5 – Trends in Annual Mean PM2.5 Concentrations
Figure A.5 –PM2.5 Daily (24-hour) 2021
Notes: 0 µg/m3 = zero data capture. Highest days for particulates in the North Street area were March, late July to early September. Lewes Road: Spring and 5th November.