Information and Brighton & Hove City Council details
Local Authority Officer
Samuel Rouse
Department
City Services, Air Quality
Address
Hove Town Hall, Norton Road, Brighton & Hove BN3 3BQ
Transport.Projects@brighton-hove.gov.uk
Phone
01273 29 0000
Report Reference Number
BHCC-ASR 2024 (up to 2023 annual monitoring data)
Date
June 2024
Executive summary: Air quality in our area
Monitoring evidence up to the end of the calendar year 2023 suggests that Nitrogen Dioxide (NO2) continue to improve long-term.
The recorded NO2 concentrations indicate for the first-time compliance with national legislation and UK air quality standards, throughout the city including in the most polluted hotspots. Further improvement is required at roadside to confirm this is the case, beyond all reasonable doubt, and sustained over at least 5 years.
Air Quality Management Area1 and AQMA3 at roadside, require further improvement to meet World Health Organisation interim targets by 2026, that is NO2, 30 µg/m3 annual average, set out in the city Air Quality Action Plan (AQAP 2022 to 2027).
Bureau Veritas have produced a complementary report that presents results from the Sussex air automatic monitoring network for Nitrogen Dioxide (NO2), fine Particulate Matter (PM2.5 and PM10) and Ozone (O3).
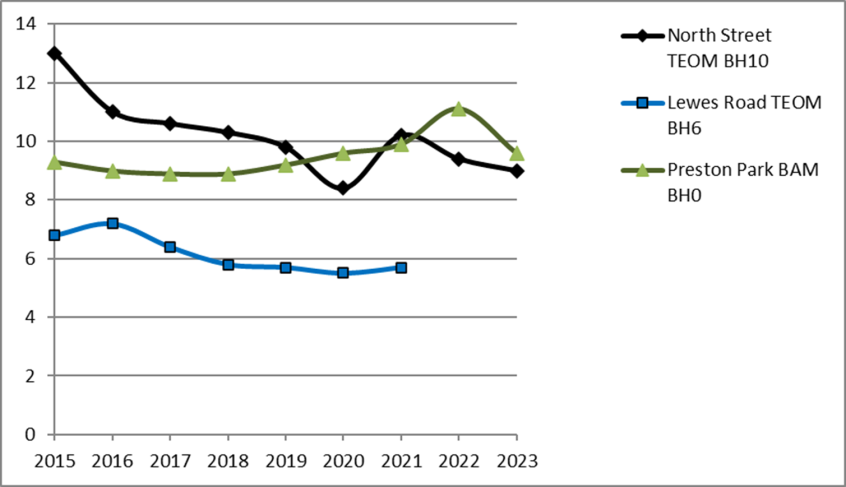
For 10 years the council’s automatic monitoring station (oxides of nitrogen and particles) is located next to North Street and the bus Ultra-Low Emissions Zone (bus-ULEZ).
As part of the national air quality monitoring network, automatic analysers monitor oxides of nitrogen, particles, and ozone, in Preston Park, Brighton.
The University of Brighton continues to monitor pollutants at Falmer. Brighton & Hove City Council (BHCC) has secured funds for additional gas and particulate monitoring to start 2024. The purpose of improved monitoring is raised awareness, community engagement and to track progress and benefits with the AQAP. Air quality is assessed with a computer-based model verified by local monitoring.
For the 2023 calendar year the council has submitted to DEFRA results for 73 verified Nitrogen Dioxide (NO2) diffusion tubes. In 2023 air quality was monitored adjacent to bus diversions via Montpelier Road and Upper North Street.
2022 to 2023 also included additional monitoring across the Hanover and Tarner residential area. Results indicated substantially lower concentrations of NO2, and relatively clean air quality compared to the city’s declared AQMAs.
Starting January 2023 councillors authorised enforcement of vehicle anti-idling; a measure aimed at reducing emissions, vehicle fumes and nuisance. This new AQAP measure activates local authority powers under the Road Traffic (Vehicle Emission) (Fixed Penalty) (England) regulations 2002.
Following completion of the bus retrofit programme, Brighton & Hove buses have continued to modernise the local bus fleet 2023 to 2024. The benefits of cleaner buses achieving ultra-low, and zero emission standards is ongoing and continues to improve annually.
All scheduled routes in the city are scheduled to meet bus-ULEZ (Ultra-low Emission Zone 2019 to 2024). That is the euro-VI emission standard by September 2024. Some of the benefits of this milestone, will come after 2023 monitoring results presented in this report. The council has been successful with its bid to Department of Transport’s Zero Bus Regional Area (ZEBRA).
Air quality in Brighton & Hove
Breathing in polluted air affects our health and costs the NHS and our society billions of pounds each year.
Air pollution is recognised as a contributing factor in the onset of heart disease and cancer and can cause a range of health impacts, including effects on lung growth, lung function, exacerbation of asthma, increases in hospital admissions and mortality. In the UK, it is estimated that the reduction in healthy life expectancy caused by air pollution is equivalent to 29,000 to 43,000 deaths a year (UK Health Security Agency. Chemical Hazards and Poisons Report, Issue 28, 2022).
Air pollution particularly affects the most vulnerable in society, children, the elderly, and those with existing heart and lung conditions.
Table ES1 provides a brief explanation of the key pollutants relevant to Local Air Quality Management and the kind of activities they might arise from. In practice health impacts will be due to the mixture of gas and particulate pollutants and their concentrations in the environment where people spend their living and sleeping hours. The mix of pollutants locally is an important consideration when considering best value interventions for a healthier environment.
Description of key pollutants
Nitrogen Dioxide (NO2)
Nitrogen dioxide is a gas which is generally emitted from high-temperature combustion processes such as road transport or energy generation. Effective hot catalysts are required to mitigate emissions and meet stricter emissions standards for vehicles and fixed heat and power, such as gas boilers.
The main health impact of NO2 is on the respiratory system. Inhalation through childhood can influence lung tissue growth, lifelong lung capacity and lung function. Dose and exposure to NO2 can increase the risk of respiratory infection. Nitrous oxides can contribute to acid rain and can damage, crops and protected habitats.
Sulphur Dioxide (SO2)
Sulphur dioxide (SO2) is a corrosive and acidic gas which is predominantly produced from the combustion of coal, crude oil, and kerosene.
Exposure to SO2 may cause irritation to the eyes, nose, throat, and bronchi constriction. Concentrations in the environment are lower than prior to ultralow sulphur petrol and diesel (2007). DEFRA monitors SO2 at and rural and industrial locations.
The council will resume monitoring SO2 in 2024.
Particulate Matter (PM10 and PM2.5)
Particulate matter is everything in the air that is not a gas. Some hot gas emissions can cool to become airborne particles or contribute to deposition.
Particles can come from natural sources such as pollen and sea salt, as well as human made sources such as smoke from fires (domestic and commercial or wildfires), emissions source include agriculture, industry, shipping and aviation and dust from tyres, brakes, demolition, and construction.
PM10 refers to particles under 10 micrometres. Fine particulate matter or PM2.5 are particles under 2.5 micrometres. Typically, combustion or hot processes emit tiny particles and mechanical process produce courser dusts.
PM2.5 when inhaled is small enough to enter the blood stream. People with underlying health conditions can be more vulnerable to dose and exposure. The pollutant can contribute to the onset of COPD (Chronic Obstructive Pulmonary Disease) and heart disease.
Figure 0‑1 Rank of Brighton & Hove City Council diffusion tubes 2023
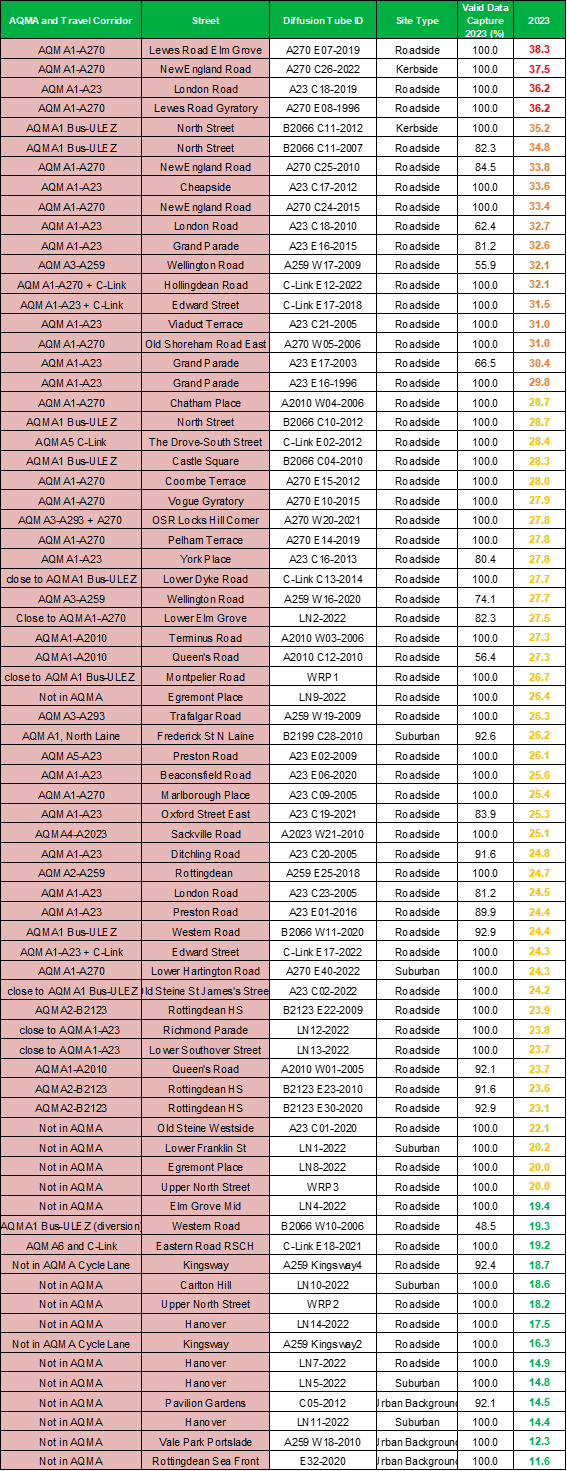
The image of the table shows the ranked order of diffusion tube results Brighton & Hove 2023 (highest at the top).
Priorities to improve air quality and achieve compliance in AQMA1:
- AQMA1 A270 link that is Lewes Road and New England Road.
- AQMA1 A23; London Road, Grand Parade and Viaduct Road.
- Bus-ULEZ B2166; North Street.
- AQMA3 A259 an A293 Portslade. Elsewhere the AQMA5 the Drove west of the railway.
All AQMAs would benefit from reduced emissions and further improvements in roadside air quality.
This will also help to improve air quality across the suburbs and citywide.
(Results adjusted for relevant receptors and bias in accordance with Technical Guidance (TG22).
Citywide and background air quality
Brighton & Hove is a proactive participant in the Sussex Air Quality Partnership and the Department of Environment (DEFRA) local authority air quality advisory group.
Find out How we manage air quality in the city, including reference to the most recent Air Quality Action Plan (AQAP for the period 2022 to 2027). The most polluted ribbons or hotspots in the city are declared as Air Quality Management Areas (AQMAs). These area maps are published nationally.
Local monitoring suggests particulate levels across the city are achieving the government’s 2040 national target (10 µg/m3) as an annual average for PM2.5 (airborne particles less than 2.5 microns).
There is excellent medical and scientific evidence showing health benefits at lower levels of pollution. A reduction in long term concentrations of particles <10 µg/m3 will have benefits for individual health and at a population level. Monitoring to date suggests particulate levels are higher in built-up areas compared to the South Downs National Park, but not more concentrated next to local roads.
This suggests a variety of local and distant emission sources contributing to breathable particles (including smoke).
Sulphurous fuels (such as coal and SO2 due to transport) have diminished substantially compared to historical levels. Road traffic including regional motorways contribute to secondary atmospheric pollution, including nitrate particles. Caution is required when comparing different particulate monitoring methods (such as partisol, BAM, TEOM, FDMS and other sensors.
Monitoring to date indicates that local particulate levels have been steady. Further analysers and sensors are being installed (locally and regionally) to determine concentrations, trends, and variability.
Nitrogen Dioxide (NO2) concentrations are monitored at background sites, including suburbs and parks remote from roads. Citywide NO2 levels have improved over the past five years. Background NO2 has been monitored with long term diffusion tubes, at Portslade Vale Park, 8 µg/m3 reduction over 5 years, annual average down from 20 to 12 µg/m3.
Automatic analyser, north of the city centre at Preston Park, improved 5 µg/m3 over 5 years down from 16 to 11 µg/m3.
City centre Pavilion Gardens improved 7 µg/m3 over 5years down from 22 to 15 µg/m3. .
Since 2020 monitoring on the sea frontage, Rottingdean also indicates a reduction in NO2.
All background monitors are remote from road and port emission sources and are outside of the designated AQMAs.
Background monitoring represents the air quality situation across the city region. That said the AQAP and cleaner vehicles have a greater positive impact at roadside and kerbside locations.
These settings are where air quality has improved the most over the past 5 and 10 years (long-term hardly influenced by variable weather, travel restrictions and one-off events).
The following summaries set out what’s new for air quality monitoring in recent years, including the monitoring surveys carried out, 2022 to 2023.
A270 Old Shoreham Road (OSR Boundary AQMA3)
For considering of a potential cycle lane extension, since 2021 a diffusion tubes survey monitored kerbside and roadside NO2 has been carried out adjacent with the Old Shoreham Road (OSR A270) in Portslade (western part of the local authority).
Where vehicles accelerate eastbound on OSR, from the Lock Hill junction diffusion tubes at the kerbside railings recorded high levels of NO2.
Monitors showed that the kerbside concentrations dissipate within one to eight metres. Monitoring continues near to the boundary of Brackenbury primary school, northern end of AQMA3 and further east close to Sackville Road.
A259 Kingsway (Outside of AQMA) potential cycle lane
Since 2021 a diffusion tubes survey has monitored kerbside and roadside NO2 next to Kingsway (A259). Results indicate that NO2 is close to half the national air quality standards and meets the ambitious AQAP target of 30 µg/m3 or the European target for 20 µg/m3, NO2.
Hanover and Tarner Pilot, Liveable Neighbourhood (AQMA1 and upslope)
2022 and 2023 survey results indicate outdoor Nitrogen Dioxide (NO2) are most concentrated at the base of the slope, and at the frontages of properties adjacent to the A23 (Grand Parade 33 µg/m3 at tube East16-2015) and A270 (Lewes Road 38 µg/m3 at East07-2019), both within AQMA1. The A23 and A270 are the main emissions sources influencing air quality in the area.
At the rear side of roadside buildings, recorded NO2 concentrations drop-off substantially. For this reason, (since 2007) new ground floor flats at roadside are designed to have their ventilation air intakes at the backs of buildings.
Between 2001 and 2008 diffusion tubes monitored NO2 outside Elm Grove Primary School. The maximum annual average recorded concentration was 38 µg/m3 in 2004, reducing to 30 µg/m3 in 2008 and 19 µg/m3 in 2023. The outdoor concentration complies with the ambitious target of 30 µg/m3 by 2026 set out in the council’s 2022 AQAP and provisional 2030 targets recently agreed by the European Parliament, that is 20 µg/m3 annual mean by 2030 (Air pollution: Parliament adopts revised law to improve air quality)
NO2 at upslope and mid-slope locations in Hanover & Tarner, set back from main roads indicate levels are 14 to 20 µg/m3. Background concentrations are broadly the same level of NO2 as Pavilion Gardens. The neighbourhood concentration of NO2 in outdoor air is less than half (36% to 50%) of the set national air quality standards.
AQMAs
The following sections refer to NO2 monitors along travel corridors in the Air Quality Management Areas that were declared or amended late-2020.
NO2 concentrations have improved at different rates in various parts of the city. Long term trend charts for NO2 pollution concentrations in and around the AQMAS are given in the main body of the report. Commentary is also given on traffic counters relevant to the AQMAs.
AQMA1 A2010 Around Brighton Railway Station
The main railway station is an important transport interchange. Automatic traffic counters on Queens Road (south of Brighton railway station) recorded a slight reduction in car and van counts compared with before the pandemic.
The monitoring suggests behavioural change (since Q1 of 2020), with less commuting since that time. Daily bus counts have been relatively constant along Queens Road. As travel activity increases, vehicles numbers around the station have recovered compared with 2020 to 2021.
Taxi pick-up has moved to the east side of the railway station which would partly explain the reduction in car trips on Queens Road.
Further vehicle surveys will seek to determine the proportion of ultra-low and zero vehicles that influences road traffic emissions and roadside air quality.
Over the past 5 years (2018 to 2023) diffusion tubes suggest NO2 has improved 16 µg/m3 next to the A2010 road and main railway station, down from 42 to 26 µg/m3. As Brighton train station is one of the busiest in the UK the improvement in air quality benefits many thousands of people.
AQMA1 North Laine through traffic
Frederick Street to Gloucester Road east of Brighton railway station is an important access route that services residences, independent retail, and the pedestrianised Brighton Laines.
Traffic counters since 2018 record a significant decrease in the number of cars using the road link. Over the same period an increase in goods vehicles both vans and lorries suggest a switch to deliveries.
In theory well used commercial vehicle fleets, will turnover and be replaced by cleaner vehicles sooner than occasionally used cars.
Monitoring adjacent to Frederick Place indicates NO2 has improved 17 µg/m3 over 5 years down from 43 to 26 µg/m3. The evidence suggests the same air quality environment as the train station frontage.
AQMA1 B2066 Bus Ultra-low Emission zone
Weekday bus counts on North Street have been recorded as:
- 2,741 a day in 2018
- 2,367 in 2020
- 2,519 in 2023.
With the introduction of zero capable hybrid buses (2018 and 2019) and a higher proportion of ultra-low vehicles, the regular bus fleet is cleaner than before.
Further improvements including exhaust upgrades have been delivered in 2023. The regular vehicle fleet that services local bus routes is on schedule to be fully compliant with bus-ULEZ and (Euro-VI) emission standard by September 2024.
Except during 2020, lorry counts along North Street have been constant. Car counts on North Street (access from side roads or licenced taxis) have declined since 2019. In the past 5 years façade NO2 next to North Street has improved almost 19 µg/m3, (average of facade diffusion tubes down from 49 to 30 µg/m3.
Since 2018, the recorded kerbside improvement (at diffusion tube C11-2012) is 49 µg/m3, down from 91 to 42 µg/m3. For comparison the hourly standard is equivalent to 60 µg/m3 as an annual average. The kerbside tube indicates compliance with the hourly NO2 standard, where pedestrians and visitors could be exposed to pollution short-term, and nobody lives for the majority of the year (procedure in accordance with UK, Technical Guidance TG(22)).
AQMA1 A23 Valley Gardens
From September 2019 the western side of Valley Gardens has been allocated to buses and taxis and the eastern side to two-way general traffic. This helped to accelerate 15 µg/m3 of improvement in NO2 on the west side of Valley Gardens down from 41 µg/m3 2018 to > 27 µg/m3 2023.
On the east side 12 µg/m3 of improvement is recorded down from 43 µg/m3 2018 to 31 µg/m3 2023 (average of 4 sites). This change has been more gradual than on the westside. Further improvements are required to meet the interim WHO guideline, a local AQAP target (2026).
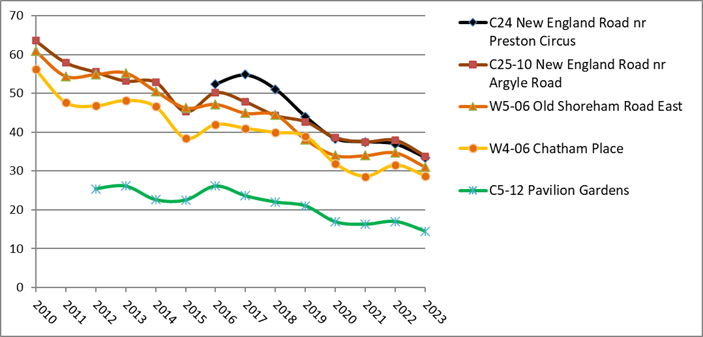
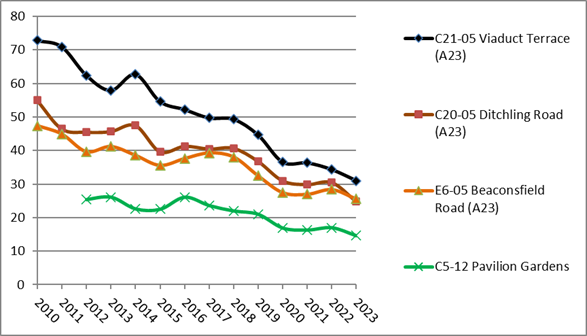
AQMA1 A23 and A270 Preston Circus
Monitoring of vehicles along Beaconsfield Road (A23) shows a decade decline in the weekday count of cars from 14,093 per day in 2013 to 11,224 in 2023.
Long term there has been a reduction in the number of daily lorries using the A23 via Preston Circus.
Bus numbers are the same as 10 years ago.
Noticeably the number of vans (light goods vehicles) has increased as follows:
Figure 0‑2 Trend in Vans through Preston Circus
A chart showing decade trend in van counts through Preston Circus A270 and A23 in AQMA1.
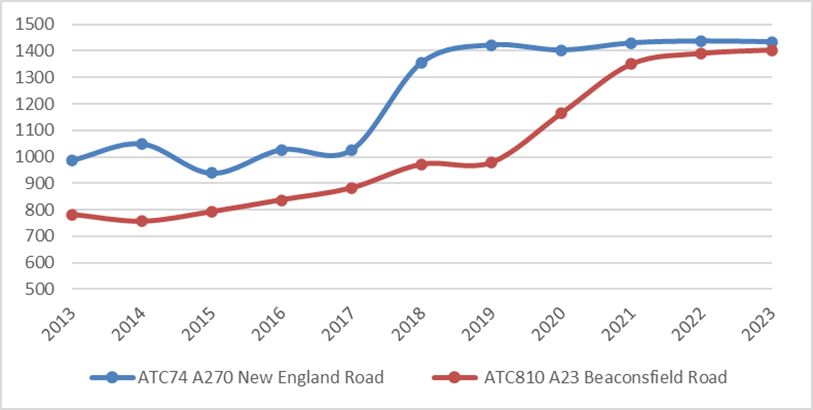
Over the past 5 years monitored NO2 next to Beaconsfield Road, Viaduct Terrace and Ditchling Road (general Brighton incoming traffic) has improved 16 µg/m3 down from 43 to 27 µg/m3.
At the same time monitoring indicates on New England Road (mostly used by cars and vans) NO2 improved 13 µg/m3 down from 45 to 32 µg/m3 and London Road area south of Preston Circus (buses and taxis) improved 20 µg/m3 down from 52 to 32 µg/m3.
AQMA1 A270 Lewes Road Travel Corridor
The Lewes Road is a key transport link between the city centre, universities, and East Sussex.
City Plan Part One sets out the Lewes Road corridor as a designated Development Area. Automatic traffic counters record an increase in motorcycles over the past 5 years. As this is not happening citywide, the evidence could suggest a sustained increase in food take-away deliveries.
Weekday car trips along Lewes Road have increased since 2021 but remain fewer than daily counts recorded 2018 and 2019. Weekday numbers of buses has increased since 2021 and 2022. The bendy buses serving this route, were retired from service late-2022.
The daily count of lorries using Lewes Road has increased compared with previous years (2018 to 2022). Comparing with 5 years ago NO2 average between Vogue Gyratory an Elm Grove has improved 17 µg/m3 down from 54 to 37 µg/m3.
For Lewes Road further focus is required to be certain of meeting air quality standards and WHO interim guidelines. From April 2024, this section has been made a parking red route (no stopping outside loading bays). At the same time, a new regulatory standard automatic analyser (oxides of nitrogen and particles PM10 and PM2.5) has been connected.
Since 2018, diffusion tube monitoring indicates the Lewes Road section along Coombe and Pelham Terrace improved 12 µg/m3 down from 40 to 28 µg/m3. Following demolition of buildings adjacent to Hollingdean Road a new regulatory standard monitoring stations has been added for gases (oxides of nitrogen, sulphur dioxide and carbon dioxide). The aim is to monitor ambient air following development changes. The new monitoring stations have been funded with a combination of the council’s Carbon Neutral Fund (CNF) and DEFRA air quality grant (2022 to 2024). Results start streaming from 2024, after this reporting cycle. Hollingdean Road is not a bus route, cars and lorries use the locally important road link.
AQMA2 A259 and B2123 Rottingdean
Traffic counts in Rottingdean High Street record a reduction in car numbers, compared to before COVID-19. Counters indicate lorry numbers increased during the period 2020 to 2022 and fell back in 2023. On the A259 East of Rottingdean village, light duty vehicles have decreased, compared with before COVID-19. With recovery in demand, counts indicate a small increase in heavy vehicles since 2020 (buses and lorries).
A yellow box in the historic High Street limits vehicle emissions in the most confined space, where residential is adjacent to the kerb. Since 2018, diffusion tube at Rottingdean façades, indicate NO2 improved 12 µg/m3 down from 36 to 24 µg/m3. NO2 levels at roadside continue to be more than twice the background level. Real-time sensors are being installed in and around AQMA2. Relatively affluent areas are more likely to replace older vehicles with relatively new ones. Cleaner vehicles in combination with active travel and public transport, can achieve further air quality improvement and WHO air quality guidelines.
AQMA3 A259 and A293 Portslade
Automatic traffic counter monitoring the A259 through AQMA3, Portslade indicates a sustained reduction in daily car, bus and lorry counts compared with prior to COVID-19. Motorcycle and van counts increased 2023, suggesting increased demand for tourism, deliveries, and servicing.
Over the past 5 years roadside façade tubes indicate NO2 improved 13 µg/m3 down from 42 to 29 µg/m3. The gradual change is like other roadside sites, and half relates to the broader regional improvement. Road traffic emissions relate to acceleration and idling between the Church Road and Boundary Road junctions. Additional monitoring in AQMA3 is being installed during 2024.
AQMA4 Old Shoreham Road and Sackville Road
New traffic counts on Sackville Road will be beneficial to monitor changes with major developments. The long-term diffusion tube indicates NO2 improved 12 µg/m3 down from 37 to 25 µg/m3. We will want to ensure that levels remain below 25 µg/m3 on arms of the road junction in AQMA4. From an air quality viewpoint, it is advisable that future development should seek to open the space surrounding the junction quadrant.
AQMA5 The Drove to South Road
Vans and cars accelerate upslope around a turning bend. From 2024 traffic is to be monitored passing through AQMA5. Since 2018, long term diffusion tubes indicate NO2 improved 14 µg/m3 down from 42 to 28 µg/m3. Further checks are required to confirm if the WHO interim is met for more than one year at roadside.
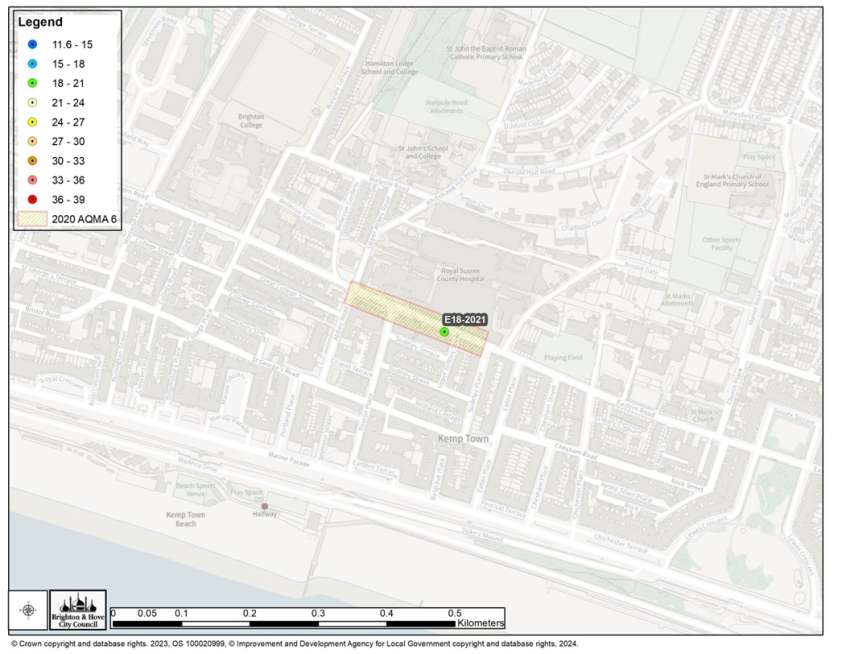
AQMA6 Eastern Road Royal County Hospital
From 2024 traffic is to be monitored passing through AQMA6. It is believed that construction activities in combination with cars and buses had an influence on emissions outside the hospital. Conditions on the Construction Environment Management plan, ask for ULEZ compliant lorries servicing NHS building projects. Since 2018, long term diffusion tubes indicate NO2 improved 16 µg/m3 down from 35 to 19 µg/m3. Since that time construction activity has increased. Some of the buses passing through AQMA6 operate is zero emission mode.
Actions to improve air quality
Whilst air quality has improved significantly in recent decades and especially over the past 5 years, there are some areas where local action is needed to protect people and the environment from the continued effects of air pollution. Local people have expressed interest in reducing emissions and cleaning the city’s air at a faster rate. This can be beneficial for the life course through childhood, learning, working age and retirement.
The Environmental Improvement Plan (Defra. Environmental Improvement Plan 2023, January 2023) sets out actions that will drive continued improvements to air quality and to meet the new national interim and long-term targets for fine particulate matter (PM2.5), the pollutant of most harmful to human health.
That said locally in designated AQMAs, NO2 continues to be the most concentrated pollutant. The impact on health is a mixture of pollution in the gas and particulate phases. The Air Quality Strategy provides more information on local authorities' responsibilities to work towards these new targets and reduce fine particulate matter and nitrates in their areas.
The Road to Zero details the government’s approach to reduce exhaust emissions from road transport through complementary mechanisms, in balance with the needs of the local community. This is important given that diesel vehicles are still popular, and Air Quality Management Areas (AQMAs) are designated due to elevated concentrations, primarily influenced by vehicular diesel emissions, with contributions from gas boilers (operational during the heating season) and fixed diesel generators (intermittent use).
Conclusions and priorities
AQMAs were first declared in Brighton & Hove City Council 20 years ago. The council monitors inside and outside the AQMAs. In recent years no exceedances have been found outside of the AQMAs. Currently there is no need to declare new areas or revoke the existing ones.
Improving long term trends are described in detail and presented in charts as part of this ASR.
The council’s AQAP aims to achieve WHO interims by 2026, that are more ambitious than the established air quality standards for England that followed the Environment Act 1995. The European parliament has recently agreed more ambitious targets for 2030.
In the next few years new developments have the potential to contribute NO2 to City AQMAs or likely influence the rate of improvement beneficially or adversely with decisions on design, energy, and emissions.
The council has consulted on the Local Transport Plan, Local Cycling and Walking Infrastructure Plan and the Air Quality Action Plan. One of the findings is that three-quarters of respondents (mostly local residence) ranked reducing pollution and improving air quality as one of their highest priorities.
Local engagement and how to get involved
Everyone can do a little bit to help improve local air quality in their city. For example, the travel and heating choices people make have an adverse or beneficial influence on the air everyone breathes:
Healthy travel choice hierarchy
- Active Travel – walking, cycling and wheeling (roller booting)
- Battery assisted bicycles
- Public Transport
- Electric car or van
- Battery vehicle with a range extender
- Petrol‐electric hybrid
- Small Petrol engine
- Diesel Hybrid
- Diesel with effective exhaust mitigation
- Diesel without exhaust mitigation
Healthy heating and cooling hierarchy
- Renewably generated electricity without combustion with passive house and grid balancing energy storage, bike ride air flow or a dip in the sea to cool down.
- Opening vents and widows to cool down in summer, insulation, and high energy performance to keep warm in the winter.
- Electric grid or local microgeneration without emissions to air
- Biogas Fired Boilers (Ultralow NOx)
- Natural Gas Fired Boilers (Ultralow NOx)
- Combined Heat and Power gas combustion (emits NOx and CO2)
- Pellet Stoves (that emit low PM & NOx)
- Log Burning with risk of smoke
- Diesel Generators that emit smoke and NOx
- Heavy fuel oil with various emissions
- Coal with sulphurous emissions (now illegal to sell in England)
Local responsibilities and commitment
This ASR was prepared by the Air Quality Officer in City Services at Brighton & Hove City Council with the support and agreement of Public Health. New for 2024, City Services includes Transport, Regulatory Services and Environmental Enforcement.
Brighton & Hove recently celebrated its 25th anniversary as a unitary authority.
Since May 2023, it has a political majority and has recently changed from a committee to cabinet arrangement for decision making.
The council is a participating member of the Sussex Air Quality Partnership and often leads on funded projects, including committing loans to support measures set out in the AQAP (2022 to 2027). The AQAP underwent detailed public consultation prior to being approved at committee, November 2022.
If you have any comments on this ASR, or related AQAP, send an email to Transport.Projects@brighton-hove.gov.uk.
Any comments on vehicle engine idling enforcement send an email to EnvironmentalEnforcement@brighton-hove.gov.uk.
Any comments on smoke control send an email to:
1. Local Air Quality Management
This report provides an overview of air quality in Brighton & Hove City Council up to an including 2023.
It fulfils the requirements of Local Air Quality Management (LAQM) as set out in Part IV of the Environment Act (1995), as amended by the Environment Act (2021), and the relevant policy and technical guidance documents. Progressive local authorities such as Oxford, Cambridge, Brighton & Hove City Council and London Boroughs have pledged to work towards more ambitions air quality guidelines. The justification of a more proactive approach considers current understanding of the health risk of airborne pollution, including medical research evidence published in the thirty years since the Environment Act (1995). At the current time, short term NO2 > 150 µg/m3 is unusually high and it is recommended that air alerts update to reflect UK ambient levels, as they are from 2024.
The LAQM process places an obligation on all local authorities to regularly review and assess air quality in their areas, and to determine if the air quality standards and guidelines are likely to be achieved. Where an exceedance of national standards is considered likely the local authority must declare an Air Quality Management Area (AQMA) and prepare an Air Quality Action Plan (AQAP) setting out the measures it intends to put in place to achieve and maintain the objectives and the dates by which each measure will be carried out. This Annual Status Report (ASR) is a requirement showing the strategies employed by Brighton & Hove City Coun to improve air quality and any progress that has been made.
The statutory air quality standards applicable to LAQM in England are presented in Table E.1.
2. Actions to improve air quality
2.1 Air Quality Management Areas
Air Quality Management Areas (AQMAs) are declared when there is an exceedance or likely exceedance of an air quality objective. After declaration, the authority should prepare an Air Quality Action Plan (AQAP) within 18 months. The AQAP should specify how air quality targets will be achieved and maintained, providing dates by which measures will be carried out.
Find a summary of AQMAs declared by Brighton & Hove City Council in Table 2.1.
The table presents a description of the number of designated AQMAs are currently designated within Brighton & Hove City Council.
Appendix D: Map(s) of Monitoring Locations and AQMAs provides maps of AQMAs and the air quality monitoring locations in relation to the AQMAs. The air quality objectives pertinent to the current AQMA designations are as follows:
- NO2 annual mean for all six, AQMAs 1 to 6
- NO2 hourly mean, AQMA1
- There are no local AQMAs for PM10 and the local authority does not have a statutory duty to declare and AQMA for PM2.5, that it has monitored locally since 2015.
The AQAP (2022 to 2027) sets out commitment to surpass WHO interims guidelines citywide for NO2 and PM2.5 by 2026 to be reported in 2027. Should national policy remain the same we propose to review the six declared AQMAs after 2025 to 2026 monitoring results.
Table 2.1 – Declared Air Quality Management Areas
First declared in 2004, Brighton & Hove City Council’s AQMAs were amended late 2020.
Consultations followed, and the AQAP was approved at committee November 2022. Find more information on our air quality pages.
2.2 Progress and impact of measures to address air quality in Brighton & Hove
Defra’s appraisal of last year’s ASR acknowledged 6 AQMAs and the approved AQAP, noting more stringent air quality targets. DEFRA accepted the 2023 ASR. DEFRA noted the monitoring and exceedances reported and that Brighton & Hove City Council had met technical guidance and data quality assurance with their report submission.
The appraisal commented that AQMAs 2 and 6 were compliant with national air quality standards. This included the calendar years 2020 and 2021, that were affected by unusual travel restrictions. AQMA6 is most likely influenced by construction activity, which ceased and has since resumed. As the City Plan has identified ambitious developments areas is advisable to retain all AQMAs for at least another year.
In response to 2023 appraisal comments, this year further information is provided on partnership working, including with public health consultants in the Director of Public Health (DPH) team. A joint presentation between the air quality officer and health consultants was given to the Health and Wellbeing Board. The air quality officer participates in Sussex Children and Young People, Asthma Network, and the Health Protection and Screening Forum. Air quality features in the Joint Strategic Need Assessment, citing links between PM2.5 and the Public Health Outcomes Framework. The DPH engages with the council’s Air Programme Board and is familiar with the ASR for air quality.
Brighton & Hove City Council has taken forward direct measures during the current reporting year of 2023 in pursuit of improving local air quality.
Details of all measures completed, in progress or planned are set out in Table 2.2.
58 measures are included within Table 2.2, with the type of measure and the progress Brighton & Hove City Council have made during the reporting year of 2023 presented. Where there have been, or continue to be, barriers restricting the implementation of the measure, these are also presented within Table 2.2.
Find more details detail on these measures in the following Action Plans:
- Local Cycling and Walking Infrastructure Plan (LCWIP)
- Beryl BTN Bikes
- Cycle hangars
- eCargo Bike Accelerator Project
- Brighton & Hove Bus Service Improvement Plan (BSIP)
- Electric vehicle (EV) charging
Key completed measures are bus retrofits (DEFRA air quality grant Lot 1) and Sustrans school and event engagement and promotional awareness of electric vehicles (DEFRA grant Lot 2).
Brighton & Hove City Council expects the new monitoring projects to be operational over the course of the next reporting year (2024). This aims to raise awareness and community engagement on cleaner local air quality (DEFRA grant lot 2). The opening section above discusses focus on the A270, Lewes Road and New England Road and the A23, London Road, Viaduct Road and Grand Parade.
Brighton & Hove City Council top 3 priorities for the coming year are:
- 1a Active travel access
- 2b Ultra-low and zero emission zone for buses and associated improvements
- 2h Fast and rapid electric chargers for vehicles
Brighton & Hove City Council worked to implement these measures in partnership with the following stakeholders during 2023 continuing into 2024:
- Neighbouring local authorities and the Sussex Air Quality Partnership
- DEFRA
- Bureau Veritas
- Matts Monitors
- Earthsense
- TES Ltd
- Tag Master UK
- Traffic GB Ltd
The principal challenges and barriers to implementation that Brighton & Hove City Council anticipates facing are sufficient staff resources to manage several contractors, ongoing monitoring, and AQAP measures.
Whilst the measures stated above and in Table 2.2 will help to contribute towards continued air quality improvement, Brighton & Hove City Council anticipates that further additional measures will be required in subsequent years to achieve healthier spaces, compliance and enable the revocation of AQMA 1 to 6, should the government keeps NO2 targets unchanged.
Table 2.2 – Progress on measures to improve air quality
2.3 PM2.5 – Local authority approach to reducing emissions and/or concentrations
As detailed in Policy Guidance LAQM.PG22 (Chapter 8) and the Air Quality Strategy, local authorities are expected to work towards reducing emissions and/or concentrations of fine particulate matter (PM2.5)). There is clear evidence that PM2.5 (particulate matter smaller 2.5 micrometres) has a significant impact on human health, including premature mortality, allergic reactions, and cardiovascular diseases.
Whilst the tiny airborne particles are not defined by composition or toxicology, when inhaled they can be drawn deep into the respiratory tract, crossing over into the blood stream.
PM2.5 is referred to in section 6.49 of the Joint Strategic Needs Assessment (JSNA) and is linked with the Public Health Outcomes Framework (PHOF). PHOF sets out a vison for public health “to protect the nations health and improve the health of the poorest fastest”.
Brighton & Hove City Council is taking the following measures to address PM2.5:
- Leading the Sussex air quality partnership in upgrading the particulate monitoring network for PM2.5 and PM10, and related pollutants and to support real-time nodes across the city - this is a Carbon Neutral Funded project supported by DEFRA, Lot 2 Awareness Raising and community engagement
- The phasing out of pre-euro-V emission standard buses - registered before October 2008 - reduces particulate emissions from the frequent bus fleet. Older buses remain for rail replacement services, driver training or heritage days. Council, taxi and haulage fleets have also made progress in phasing our pre-euro 5 vehicles
- At the time of 2023 monitoring >85% of regular bus services will surpass the ULEZ, euro-VI emission standard that targets reduction in oxides of nitrogen that are precursors to the formation of nitrate particles in the atmosphere, and also help reduce N2O a potent greenhouse gas
- The council is in talks with University of London regarding improving true wheel alignment and tyre pressure to reduce tyre and road wear and particulate releases to air
- Construction Environment Management Plans have progressively more stringent emissions standards for Non-Road Mobile Machinery that includes bulldozers, dumpers, and cranes, it recommended going forwards these standards are enforced especially on major projects, development areas, in or near AQMAs
- Static diesel generators are discouraged for building and road work events, especially those in the city centre that are likely to last more than a few days
- Members have requested that officers research the advantages of Smoke Control Areas (SCA). Parliament approved amendments to the Environment Act (2021) sets out stronger powers for Local Authorities. In 2023 funding is allocated to Brighton & Hove, Environmental Health for enforcement of its existing SCAs. Officer training on smoke control has also been made available in 2023.
- In the interests of communal health, the council issued a series of public statements discouraging indoor and outdoor domestic burning during the COVID-19 pandemic
- Further press releases on reducing seasonal burning outlining the risks of air pollutants due to bonfires in the city.
- To complement Defra’s automatic urban rural monitoring network (site at Preston Park) the council has for several years monitored PM2.5
- Further guidance is available under the PM2.5 and Action Planning section of Technical Guidance LAQM.TG16 (Chapter 2)
At Preston Park and North Street monitoring suggests concentrations more than the WHO daily recommended level of 10 µg/m3 annual mean, DEFRA’s national target to be met by 2040.
Find more details in Table A8.
2021 WHO recommendations and interims have been published since the writing of the 2020 ASR and these have been adopted in the 2022 AQAP
3. Air Quality Monitoring Data and comparison with air quality objectives and national compliance
This section sets out the monitoring undertaken within 2023 by Brighton & Hove City Council and how it compares with the relevant air quality objectives. In addition, monitoring results are presented for a five-year period between 2019 and 2023 to allow monitoring trends to be identified and discussed.
3.1 Summary of monitoring undertaken
3.1.1 Automatic monitoring sites
In Brighton & Hove City Council automatic (continuous) monitoring was undertaken at 2 sites during 2023. Table A.1 in Appendix A shows the details of the automatic monitoring sites.
NB. Local authorities do not have to report annually on the following pollutants:
- 1,3 butadiene
- benzene
- carbon monoxide
- lead
unless local circumstances indicate there is a problem.
Find latest results for particles and gases.
Find Automatic Urban Rural Monitoring results including Preston Park.
Maps showing the location of the monitoring sites are provided in Appendix D.
Further details on how the monitors are calibrated and how the data has been adjusted are included in Appendix C.
3.1.2 Non-automatic monitoring sites
Brighton & Hove City Council undertook non- automatic (passive) monitoring of NO2 at 73 sites during 2023. Table A.2 in Appendix A presents the details of the non-automatic sites.
Maps showing the location of the monitoring sites are provided in Appendix D. Further details on Quality Assurance and Quality Control (QA and QC) for the diffusion tubes, including bias adjustments and any other adjustments applied (for example, annualisation and/or distance correction), are included in Appendix C.
3.2 Individual pollutants
The air quality monitoring results presented in this section are, where relevant, adjusted for bias, annualisation (where the annual mean data capture is below 75% and greater than 25%), and distance correction. Further details on adjustments are provided in Appendix C.
3.2.1 Nitrogen Dioxide (NO2)
Table A.3 and Table A.4 in Appendix A compare the ratified and adjusted monitored NO2 annual mean concentrations for the past 5 years with the air quality objective of 40µg/m3. Note that the concentration data presented represents the concentration at the location of the monitoring site, following the application of bias adjustment and annualisation, as required (meaning, the values are exclusive of any consideration to fall-off with distance adjustment).
For diffusion tubes, the full 2023 dataset of monthly mean values is provided in Appendix B. Note that the concentration data presented in Table B.1 includes distance corrected values, only where relevant.
Table A.5 in Appendix A compares the ratified continuous monitored NO2 hourly mean concentrations for the past 5 years with the air quality objective of 200µg/m3, not to be exceeded more than 18 times per year.
3.2.2 Particulate Matter (PM10)
Since 2015 Brighton & Hove has monitored PM2.5 instead of PM10. The relatively course fraction of airborne particulate was more likely to comply with national standards. The preference for PM2.5 monitoring aligned more closely with Public Health Outcome Framework. As funding is now available Brighton & Hove City Council and Sussex are scheduled from 2024 onwards to monitor both:
- PM10 throat and upper respiratory impacts with contributions from local emission sources
- PM2.5 influence on the blood stream when inhaled with contributions from local, regional, and international emission sources (direct particles and gases)
3.2.3 Particulate Matter (PM2.5)
Table A.6 in Appendix A presents the ratified and adjusted monitored PM2.5 annual mean concentrations for the past 5 years. Further improvement is required to certainly surpass 2010 WHO guidelines and work towards 2021 WHO guidelines for annual and daily averages and the interim targets set out in Brighton & Hove City Council’s AQAP.
3.2.4 Sulphur Dioxide (SO2)
Sulphur Dioxide levels have been found to comply with national standards and world health guidelines across the Greater Brighton area. Reduced coal burning, ultralow sulphur petrol and diesel (2007) and fewer diesel trains have helped bring down levels of sulphurous gas and particles. The University of Brighton received a £250K research fund for monitoring.
Find results for SO2, particles and other pollutants. The monitoring station is in a field at Falmer (south of the A27 road and Brighton to Lewes railway) and included in the summary appendix of Brighton & Hove automatic analysers.
The council plans to introduce SO2 monitoring in AQMA1 (City Centre) and AQMA3 (set back from the A259 and harbour). This can monitor progress in the reduction of marine emissions set out in the national air quality strategy and local projects. Results can be compared to the Automatic Rural Network monitor at Lullington Health in the South Downs National Park.
Appendix A: Monitoring results
Tables A.1 to A.4
View and download the following tables:
- Table A.1 – Details of automatic monitoring sites
- Table A.2 – Details of non-automatic monitoring sites
- Table A.3 – Annual Mean NO2 Monitoring Results: Automatic Monitoring (µg/m3)
- Table A.4 – Annual Mean NO2 Monitoring Results: Non-Automatic Monitoring (µg/m3)
Notes for Table A.1
(1) 0m if the monitoring site is at a location of exposure (for example, installed on the façade of a residential property).
(2) N/A if not applicable
Notes for Table A.2
(1) 0m if the monitoring site is at a location of exposure (for example, installed on the façade of a residential property).
(2) N/A if not applicable.
Notes for Table A.3
Annualisation has not been considered and is not required as all sites have >75% data capture.
Reported concentrations are those at the location of the monitoring site (annualised, as required), meaning, prior to any fall-off with distance correction.
Where exceedances of the NO2 annual mean objective occur at locations not representative of relevant exposure, the fall-off with distance concentration has been calculated and reported concentration provided in brackets for 2023
Notes:
The annual mean concentrations are presented as µg/m3.
Exceedances of the NO2 annual mean objective of 40µg/m3 are shown in bold.
All means have been “annualised” as per LAQM.TG22 if valid data capture for the full calendar year is less than 75%. See Appendix C for details.
Concentrations are those at the location of monitoring and not those following any fall-off with distance adjustment.
(1) Data capture for the monitoring period, in cases where monitoring was only carried out for part of the year.
(2) Data capture for the full calendar year (for example, if monitoring was carried out for 6 months, the maximum data capture for the full calendar year is 50%).
Notes for Table A.4
Annualisation has been conducted where data capture is <75% and >25% in line with LAQM.TG22
Diffusion tube data has been bias adjusted.
Reported concentrations are those at the location of the monitoring site (bias adjusted and annualised, as required), meaning prior to any fall-off with distance correction.
Notes:
The annual mean concentrations are presented as µg/m3.
Exceedances of the NO2 annual mean objective of 40µg/m3 are shown in bold.
NO2 annual means exceeding 60µg/m3, indicating a potential exceedance of the NO2 1-hour mean objective are shown in bold and underlined.
Means for diffusion tubes have been corrected for bias. All means have been “annualised” as per LAQM.TG22 if valid data capture for the full calendar year is less than 75%. See Appendix C for details.
Concentrations are those at the location of monitoring and not those following any fall-off with distance adjustment.
(1) Data capture for the monitoring period, in cases where monitoring was only carried out for part of the year.
(2) Data capture for the full calendar year (for example, if monitoring was carried out for 6 months, the maximum data capture for the full calendar year is 50%).
Figure A.1 – Trends in Annual Mean NO2 Concentrations
AQMA1 Railway Station Approach
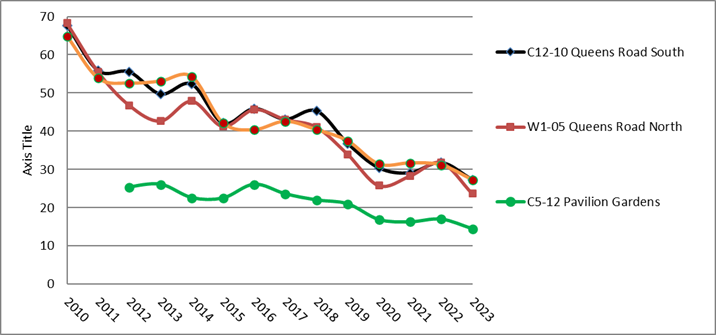
AQMA1 North Laine
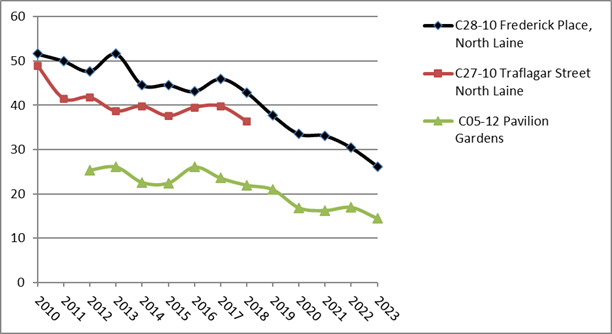
Trend graph in Nitrogen Dioxide in the vicinity of Brighton railway station indicates a substantial improvement between 2010 and 2020 (variation in the rate of pollution reduction).
Levelling since 2020 and improvement in 2023. Emission reductions are required to keep pollutant levels (NO2) below the AQAP target of 30 µg/m3. Results compared to background.
AQAM1 New England Road
AQMA1 Bus-ULEZ
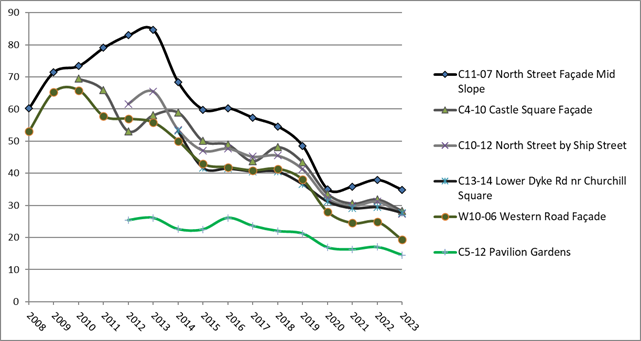
Trend chart in Nitrogen Dioxide in the bus-ULEZ and New England Road showing substantial improvement since 2013.
Levelling since 2020 and improvement in 2023. Emission reductions are required to keep pollutant levels (NO2) below the national standard and AQAP target of 30 µg/m3. Results compared to background.
AQMA1 South Preston Circus Area
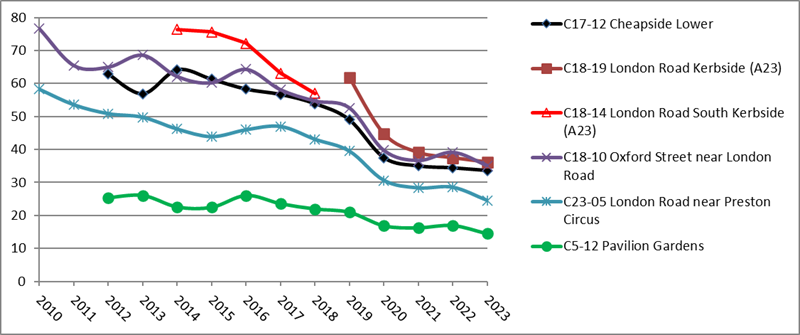
Trend graphs in Nitrogen Dioxide A23 London Road and Viaduct Road areas, showing long term improvement since 2014.
Levelling since 2020 and improving again 2023. Emission reductions are required to keep pollutant levels (NO2) below English standards and AQAP target of 30 µg/m3. Roadside compared with background.
AQAMA1 Lewes Road Area
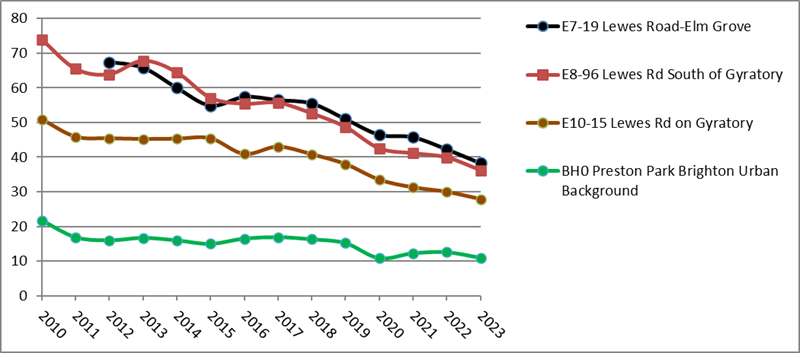
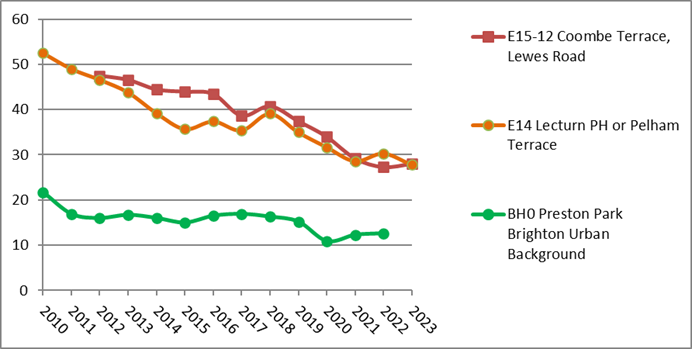
Trend graphs in Nitrogen Dioxide A270 Lewes Road area, showing long term improvement since 2018.
Levelling since 2020 and improving again recently. Emission reductions are required to keep pollutant levels (NO2) below English standards and AQAP target of 30 µg/m3. Roadside compared with background.
AQAM2 Rottingdean
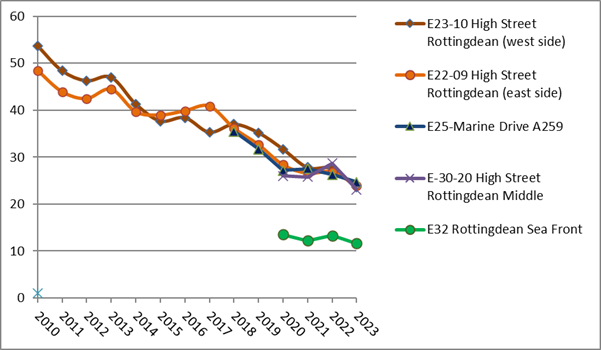
AQAM3 Portslade
Trend graphs in Nitrogen Dioxide AQMA2, Rottingdean and AQMA3, Portslade showing gradual improvement long term.
Emission reductions are required for sustained pollutant levels (NO2) below English standards and the AQAP target of 30 µg/m3. Roadside compared with background.
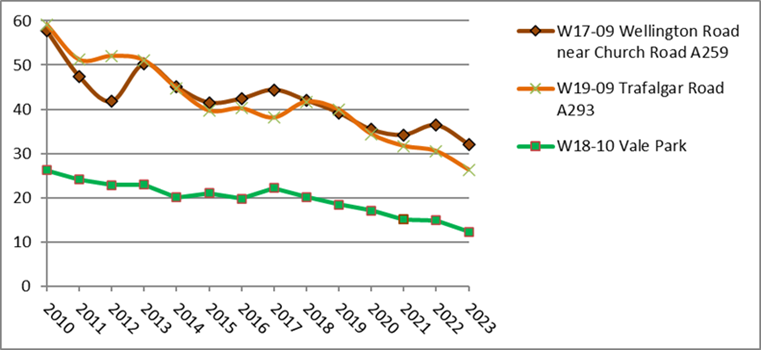
Trafalgar Road A293, Vale Park
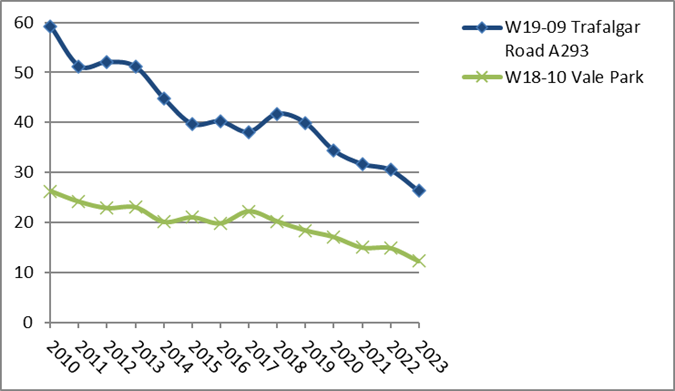
AQMA4 Sackville Road
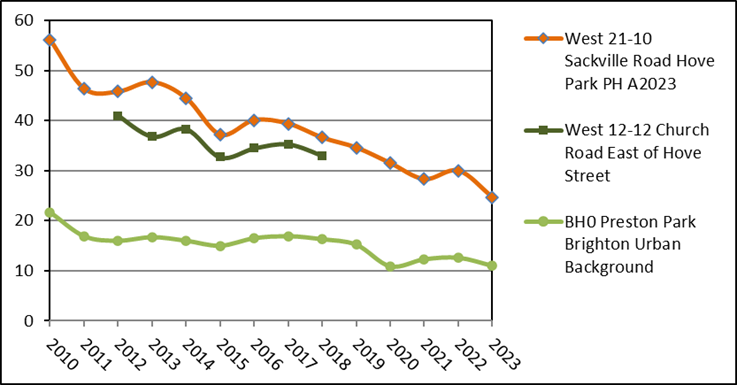
Trend graphs in Nitrogen Dioxide AQMA3, Portslade and AQMA4, Sackville Road showing gradual improvement long term.
Emission reductions are required to keep pollutant levels (NO2) below English standards and AQAP target of 30 µg/m3. Roadside compared with background.
AQAM5 The Drove
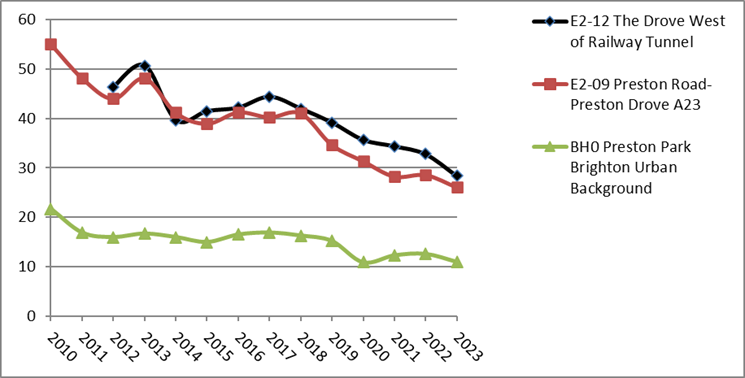
AQMA6 Hospital
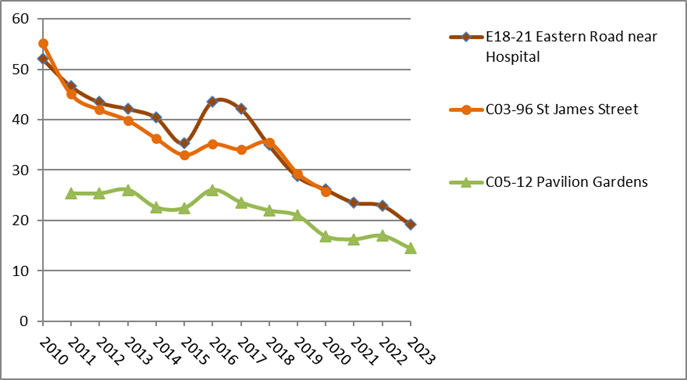
Trend graphs in Nitrogen Dioxide AQMA5, South Road (The Drove) and AQMA6 Eastern Road (RSC Hospital) showing improvement long term and recently.
Emission reductions are required to keep pollutant levels (NO2) below European targets 20 µg/m3. Roadside compared with background.
Table A.5 – 1-Hour mean NO2 monitoring results, number of 1-hour means > 200 µg/m3
View and download Table A.5 – 1-Hour Mean NO2 Monitoring Results, Number of 1-Hour Means > 200µg/m3.
Notes for Table A.5
At automatic analysers there were not recorded exceedances of the hourly standard since 2017 to 2018.
Since the last ASR, Bureau Veritas updated previously reported data from the North Street analyser for 2022.
The WHO recommends daily targets for NO2.
Results are presented as the number of 1-hour periods where concentrations greater than 200µg/m3 have been recorded.
Exceedances of the NO2 1-hour mean objective (200µg/m3 not to be exceeded more than 18 times/year) are shown in bold.
If the period of valid data is less than 85%, the 99.8th percentile of 1-hour means is provided in brackets.
(1) Data capture for the monitoring period, in cases where monitoring was only carried out for part of the year.
(2) Data capture for the full calendar year (for example, if monitoring was carried out for 6 months, the maximum data capture for the full calendar year is 50%).
Table A.8 – Annual Mean PM2.5 Monitoring Results (µg/m3)
View and download Table A.6 – Annual Mean PM2.5 Monitoring Results (µg/m3).
Notes for Table A.8
Annualisation was considered and not required because data capture for PM2.5 automatic analysers in Brighton & Hove City Council, 2023 was >75%
The annual mean concentrations are presented as µg/m3.
All means have been “annualised” as per LAQM.TG22 if valid data capture for the full calendar year is less than 75%. See Appendix C for details.
(1) Data capture for the monitoring period, in cases where monitoring was only carried out for part of the year.
(2) Data capture for the full calendar year (for example, if monitoring was carried out for 6 months, the maximum data capture for the full calendar year is 50%).
Figure A.2 – Trends in Annual Mean PM2.5 Concentrations
Appendix B: Full Monthly Diffusion Tube Results for 2023
Table B.1 – NO2 2023 Diffusion Tube Results (µg/m3)
View and download Table B.1 – NO2 2023 Diffusion Tube Results (µg/m3).
Notes for Table B.1
All erroneous data has been removed from the NO2 diffusion tube dataset presented in Table B.1.
Annualisation has been conducted where data capture is <75% and >25% in line with LAQM.TG22.
National bias adjustment factor used of 0.81 used 2023 and 0.85, 2022.
Where applicable, data has been distance corrected for relevant exposure in the final column.
Confirm that all 2023 diffusion tube data has been uploaded to the Diffusion Tube Data Entry System.
Exceedances of the NO2 annual mean objective of 40µg/m3 are shown in bold.
NO2 annual means exceeding 60µg/m3, indicating a potential exceedance of the NO2 1-hour mean objective are shown in bold and underlined.
See Appendix C for details on bias adjustment and annualisation.
Appendix C: Supporting technical information and air quality monitoring data QA and QC
New or changed sources identified within Brighton & Hove City Council during 2023
In AQMA1 new developments have been completed next to Hollligdean Road, Lewes Road and London Road.
For the reporting year, new developments around AQMA2 and in the adjacent local authority that is Lewes District Council.
Around AQMA3, new development completed around Shoreham Port and next to the A259.
In AQMA4 some progression with the associated development area around Hove Station that requires further monitoring.
No discernible changes in AQMA5. In AQMA6 the Royal Sussex County Hospital has new gas boilers, a new phase of construction and new building arrangements (ongoing 2023 to 2024) and parallel with Eastern Road.
Some of the buses are geo-references for zero emissions when travelling through the majority of AQMAs, this has not yet happened along the Lewes Road corridor.
Additional air quality works undertaken by Brighton & Hove City Council during 2023
Completion of engagement with schools and events on active travel and air quality. Completion of bus retrofit programme to upgrade from euro-V to euro-VI on frequent Brighton & Hove buses used across the region, including services that start and finish at Churchill Square, Central Brighton & Hove bus-ULEZ.
QA and QC of diffusion tube monitoring
- Gradko International diffusion tubes have been consistently used for many years by Sussex Local Authorities using the 20% TEA in water (method). This continued throughout 2023.
- Gradko participates in accreditation scheme AIR PT including annual field inter field comparison exercise,
- 2023 diffusion tube monitoring covered twelve periods for the calendar year. Exposure periods typically alternated between 4 and 5 weeks and showed good agreement with the 2023 Diffusion Tube Monitoring Calendar, performance improved compared to previous years.
- Annualisation has been carried out for tubes monitoring sites with between 3 and 9 months data
Diffusion tube annualisation
6 out of 73 of 2023 Brighton & Hove City Council diffusion tubes had less than 75% data capture and the annulisation adjustment is set out below in accordance with technical guidance.
Table C.1 – Annualisation summary (concentrations presented in µg/m3)
| Site ID + year started | Annualisation factor AURN BH0 Preston Park | Annualisation factor AURN Preston Park | Average Annualisation factor | Raw data annual mean | Annualised annual mean |
|---|---|---|---|---|---|
| A2010 C12-2010 | 0.9510 | 0.8902 | 0.9206 | 36.6 | 33.7 |
| A23 C18-2010 | 1.0322 | 1.0069 | 1.0195 | 42.5 | 43.3 |
| A23 E17-2003 | 1.0236 | 1.0749 | 1.0493 | 35.8 | 37.5 |
| B2066 W10-2006 | 0.9148 | 0.8732 | 0.8940 | 26.6 | 23.8 |
| A259 W16-2020 | 0.9935 | 0.9413 | 0.9674 | 34.2 | - |
| A259 W17-2009 | 1.0007 | 1.0158 | 1.0082 | 39.3 | 39.6 |
Diffusion Tube Bias Adjustment Factors
The diffusion tube data presented within the 2024 ASR have been corrected for bias using an adjustment factor. Bias represents the overall tendency of the diffusion tubes to under or over-read relative to the reference chemiluminescence analysers. LAQM.TG22 provides guidance about the application of a bias adjustment factor to correct diffusion tube monitoring. Triplicate co-location studies can be used to determine a local bias factor based on the comparison of diffusion tube results with data taken from NOx/NO2 continuous analysers. The national database of diffusion tube co-location surveys provides bias factors for the relevant laboratory and preparation method.
Brighton & Hove City Council have applied a national bias adjustment factor of 0.81 to all 2023 diffusion tube data. Bureau Veritas updated 2022 results for the North Street NO2 monitor after submission of the 2023 ASR. Revised automatic analyser result is changed in this ASR and the 2022 raw data adjusted by 0.85 in accordance with national adjustment. This correction shows closer agreement with long term trends in NO2. A summary of bias adjustment factors used by Brighton & Hove City Council over the past five years is presented in Table C.2.
Table C.2 – Bias Adjustment Factor
| Monitoring year | Local or national | If national, version of national spreadsheet | Adjustment factor |
| 2023 | Local | 03/24 | 0.81 |
| 2022 | National | 09/23 | 0.85 |
| 2021 | National | 03/21 | 0.84 |
| 2020 | National | 06/20 | 0.92 |
| 2019 | National | 06/19 | 0.93 |
Notes:
A single local bias adjustment factor *0.81 has been used to bias adjust the 2023 diffusion tube results. This is derived from the Gradko laboratory co-location studies for 2023.
NO2 Fall-off with distance from the road
Wherever possible, monitoring locations are representative of exposure. However, where this is not possible, the NO2 concentration at the nearest location relevant for exposure has been estimated using the Diffusion Tube Data Processing Tool/NO2 fall-off with distance calculator available on the LAQM Support website. Where appropriate, non-automatic annual mean NO2 concentrations corrected for distance are presented in Table B.1.
Table C.3 – Non-automatic NO2 fall off with distance calculations (concentrations presented in µg/m3)
| Site ID | Distance (m): monitoring site to kerb | Distance (m): receptor to kerb | Monitored concentration (Annualised and bias adjusted | Background concentration | Concentration predicted at receptor | Comments |
|---|---|---|---|---|---|---|
| B2066 C11-2012 | 1.5 | 4.5 | 41.7 | 14.6 | 35.2 | To test hourly standard |
| A23 C18-2019 | 2.0 | 4.0 | 36.2 | 14.6 | 32.7 | To test hourly standard |
| A270 C26-2022 | 2.5 | 5.0 | 43.0 | 10.9 | 37.5 | Predicted concentration at Receptor within 10% of AQS standard. |
QA and QC of automatic monitoring
Data management of automatic analyser is carried out by Bureau Veritas. Equipment support and local service operation during 2023 at North Street was carried out by Matt’s Monitors. Data presented in the report is ratified.
PM10 and PM2.5 monitoring adjustment
Particulate (PM2.5) monitoring data provided by Bureau Veritas to the Sussex Air Quality Network includes appropriate correction factors.
Automatic monitoring annualisation
The North Street monitoring site reported for 2023 has at least >90% data capture for NOx and NO2 and PM2.5.
NO2 Fall-off with distance from the road
No automatic NO2 monitoring locations within Brighton & Hove require distance correction during 2023. Wherever possible, monitoring locations are representative of exposure.
Appendix D: Map(s) of monitoring locations and AQMAs
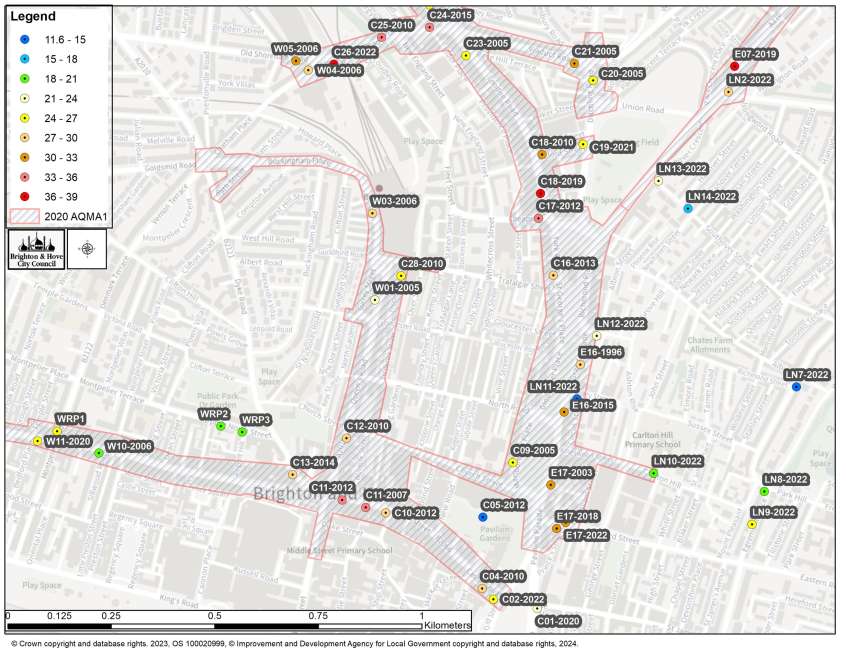
Figure D.1 – Map of Non-automatic monitoring sites
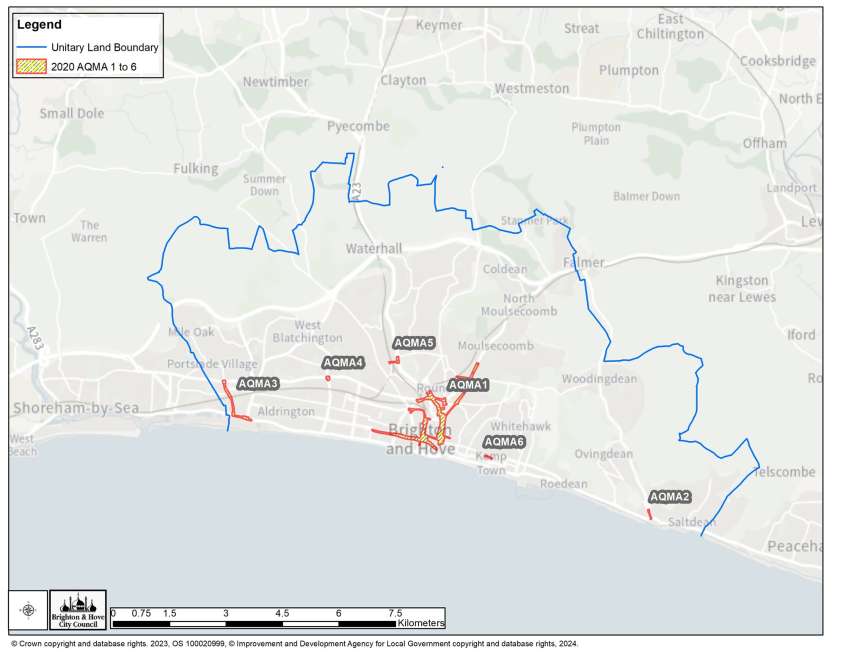
Brighton & Hove map showing air quality management areas (declared for NO2) and the local authority boundary
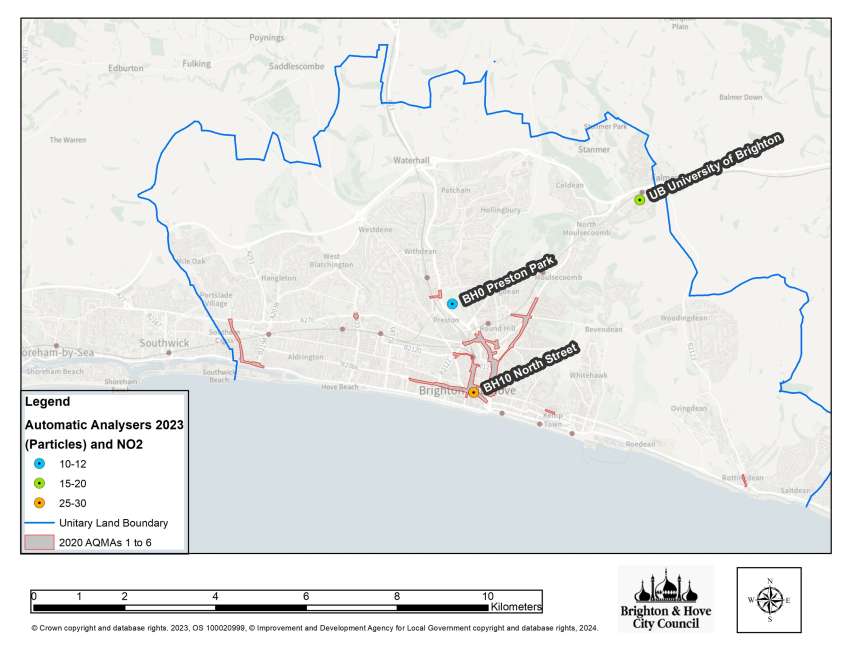
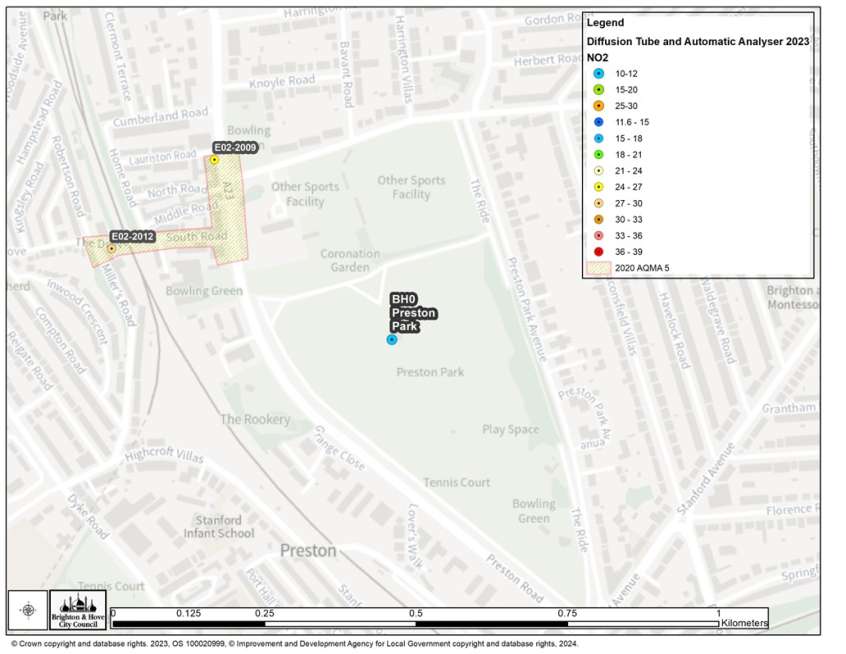
Brighton & Hove 2023 automatic analysers NO2 and particles (colour coded by NO2) and the current AQMAs
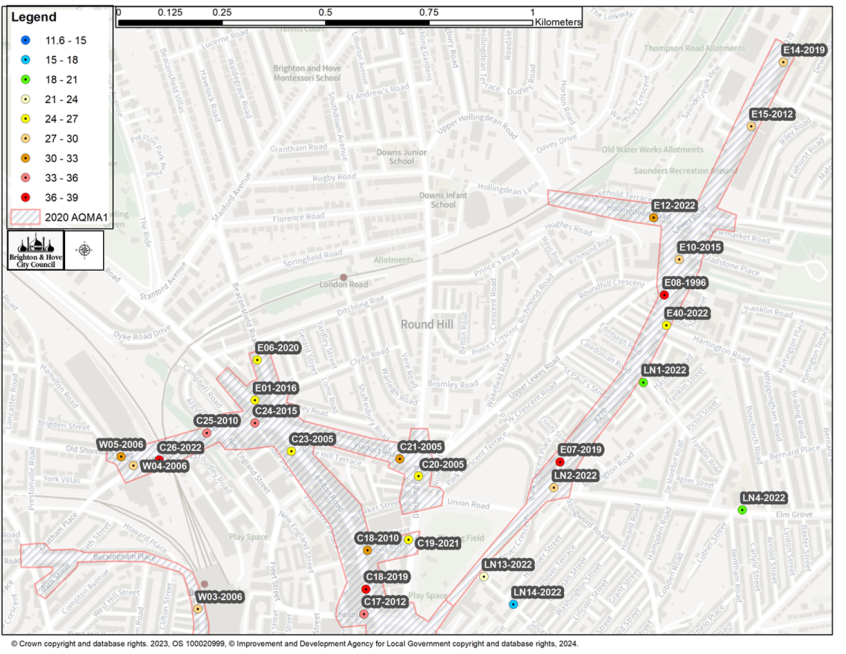
AQMA1 north and diffusion tubes (colour coded by 2023 concentration)
AQMA1 south and diffusion tubes (colour coded by 2023 concentration)
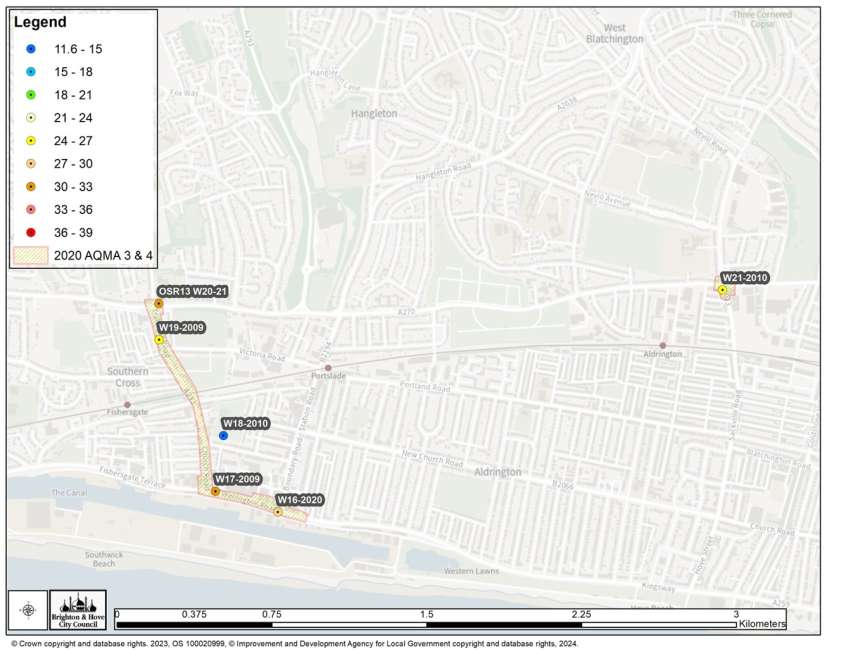
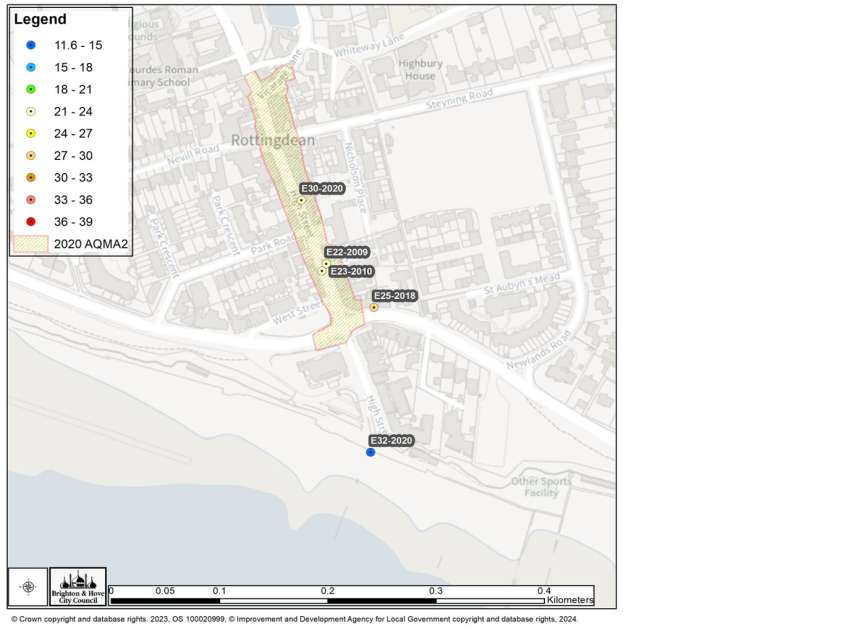
AQMAs 2 to 6 and diffusion tubes (colour coded by 2023 concentration)
Appendix E: Summary of air quality objectives in England
Table E.1 – Air quality objectives in England
The units are in microgrammes of pollutant per cubic metre of air (µg/m3).
| Pollutant | Air quality objective: Concentration | Air quality objective: Measured as |
|---|---|---|
| Nitrogen Dioxide (NO2) | 200µg/m3 not to be exceeded more than 18 times a year | 1-hour mean |
| Nitrogen Dioxide (NO2) | 40µg/m3 | Annual mean |
| Particulate Matter (PM10) | 50µg/m3, not to be exceeded more than 35 times a year | 24-hour mean |
| Particulate Matter (PM10) | 40µg/m3 | Annual mean |
| Sulphur Dioxide (SO2) | 350µg/m3, not to be exceeded more than 24 times a year | 1-hour mean |
| Sulphur Dioxide (SO2) | 125µg/m3, not to be exceeded more than 3 times a year | 24-hour mean |
| Sulphur Dioxide (SO2) | 266µg/m3, not to be exceeded more than 35 times a year | 15-minute mean |
Glossary of terms
| Abbreviation | Description |
|---|---|
| ADMS-Urban | Atmospheric Dispersion Model System |
| AQAP | Air Quality Action Plan - A detailed description of measures, outcomes, achievement dates and implementation methods, showing how the local authority intends to achieve air quality limit values’ |
| AQMA | Air Quality Management Area – An area where air pollutant concentrations exceed / are likely to exceed the relevant air quality objectives. AQMAs are declared for specific pollutants and objectives |
| ASR | Air Quality Annual Status Report |
| ATC | Automatic Traffic Counter |
| AURN | UK Automatic Urban Rural Air Monitoring Network |
| CAZ | Clean Air Zone |
| CEMP | Construction Environment Management Plans |
| COMEAP | Committee on the Medical Effects of Air Pollutants |
| Defra | Department for Environment, Food and Rural Affairs |
| DfT | Department for Transport |
| DMRB | Design Manual for Roads and Bridges – Air quality screening tool produced by Highways England |
| EFT | Emission Factor Toolkit |
| EMIT | Atmospheric Emissions Inventory Toolkit |
| EU | European Union |
| HGV | Heavy Goods Vehicle |
| LAQM | Local Air Quality Management |
| LAQM (TG)16 | LAQM Technical Guidance 2016 |
| LAQM (PG)16 | LAQM Policy Guidance 2016 |
| LGV | Light Goods Vehicle |
| NRMM | Non Road Mobile Machinery |
| NAEI | National Atmospheric Emissions Inventory |
| NO2 | Nitrogen Dioxide |
| NOx | Oxides of Nitrogen usually an emission rather than an outdoor concentration |
| NPL | National Physical Laboratory |
| PHE | Public Health England |
| PHOF | Public Health Outcomes Framework |
| PM10 | Airborne particulate matter with an aerodynamic diameter of 10µm (micrometres or microns) or less |
| PM2.5 | Airborne particulate matter with an aerodynamic diameter of 2.5µm or less |
| QA/QC | Quality Assurance and Quality Control |
| SCA | Smoke Control Zone |
| Section 106 | Section 106 Planning Agreement Under Town and Country Planning Act |
| SO2 | Sulphur Dioxide |
| ULEZ | Ultralow Emissions Zone |